使用Prometheus+Grafana监控Ceph
在Ceph Luminous(12.x)之前的版本,可以使用第三方的ceph_exporter采集Ceph集群的监控信息。 从Ceph Luminous 12.2.1版本开始,MGR中自带了Prometheus插件,内置了Prometheus Ceph Exporter,可以使用Ceph MGR内置的exporter作为Prometheus的target。
启用Prometheus监控模块
在任意一台MGR节点执行如下命令启用Prometheus监控模块
1 | ceph mgr module enable prometheus |
启用成功后在MGR节点上查看mgr的监听端口
1 | # netstat -ntple | grep mgr |
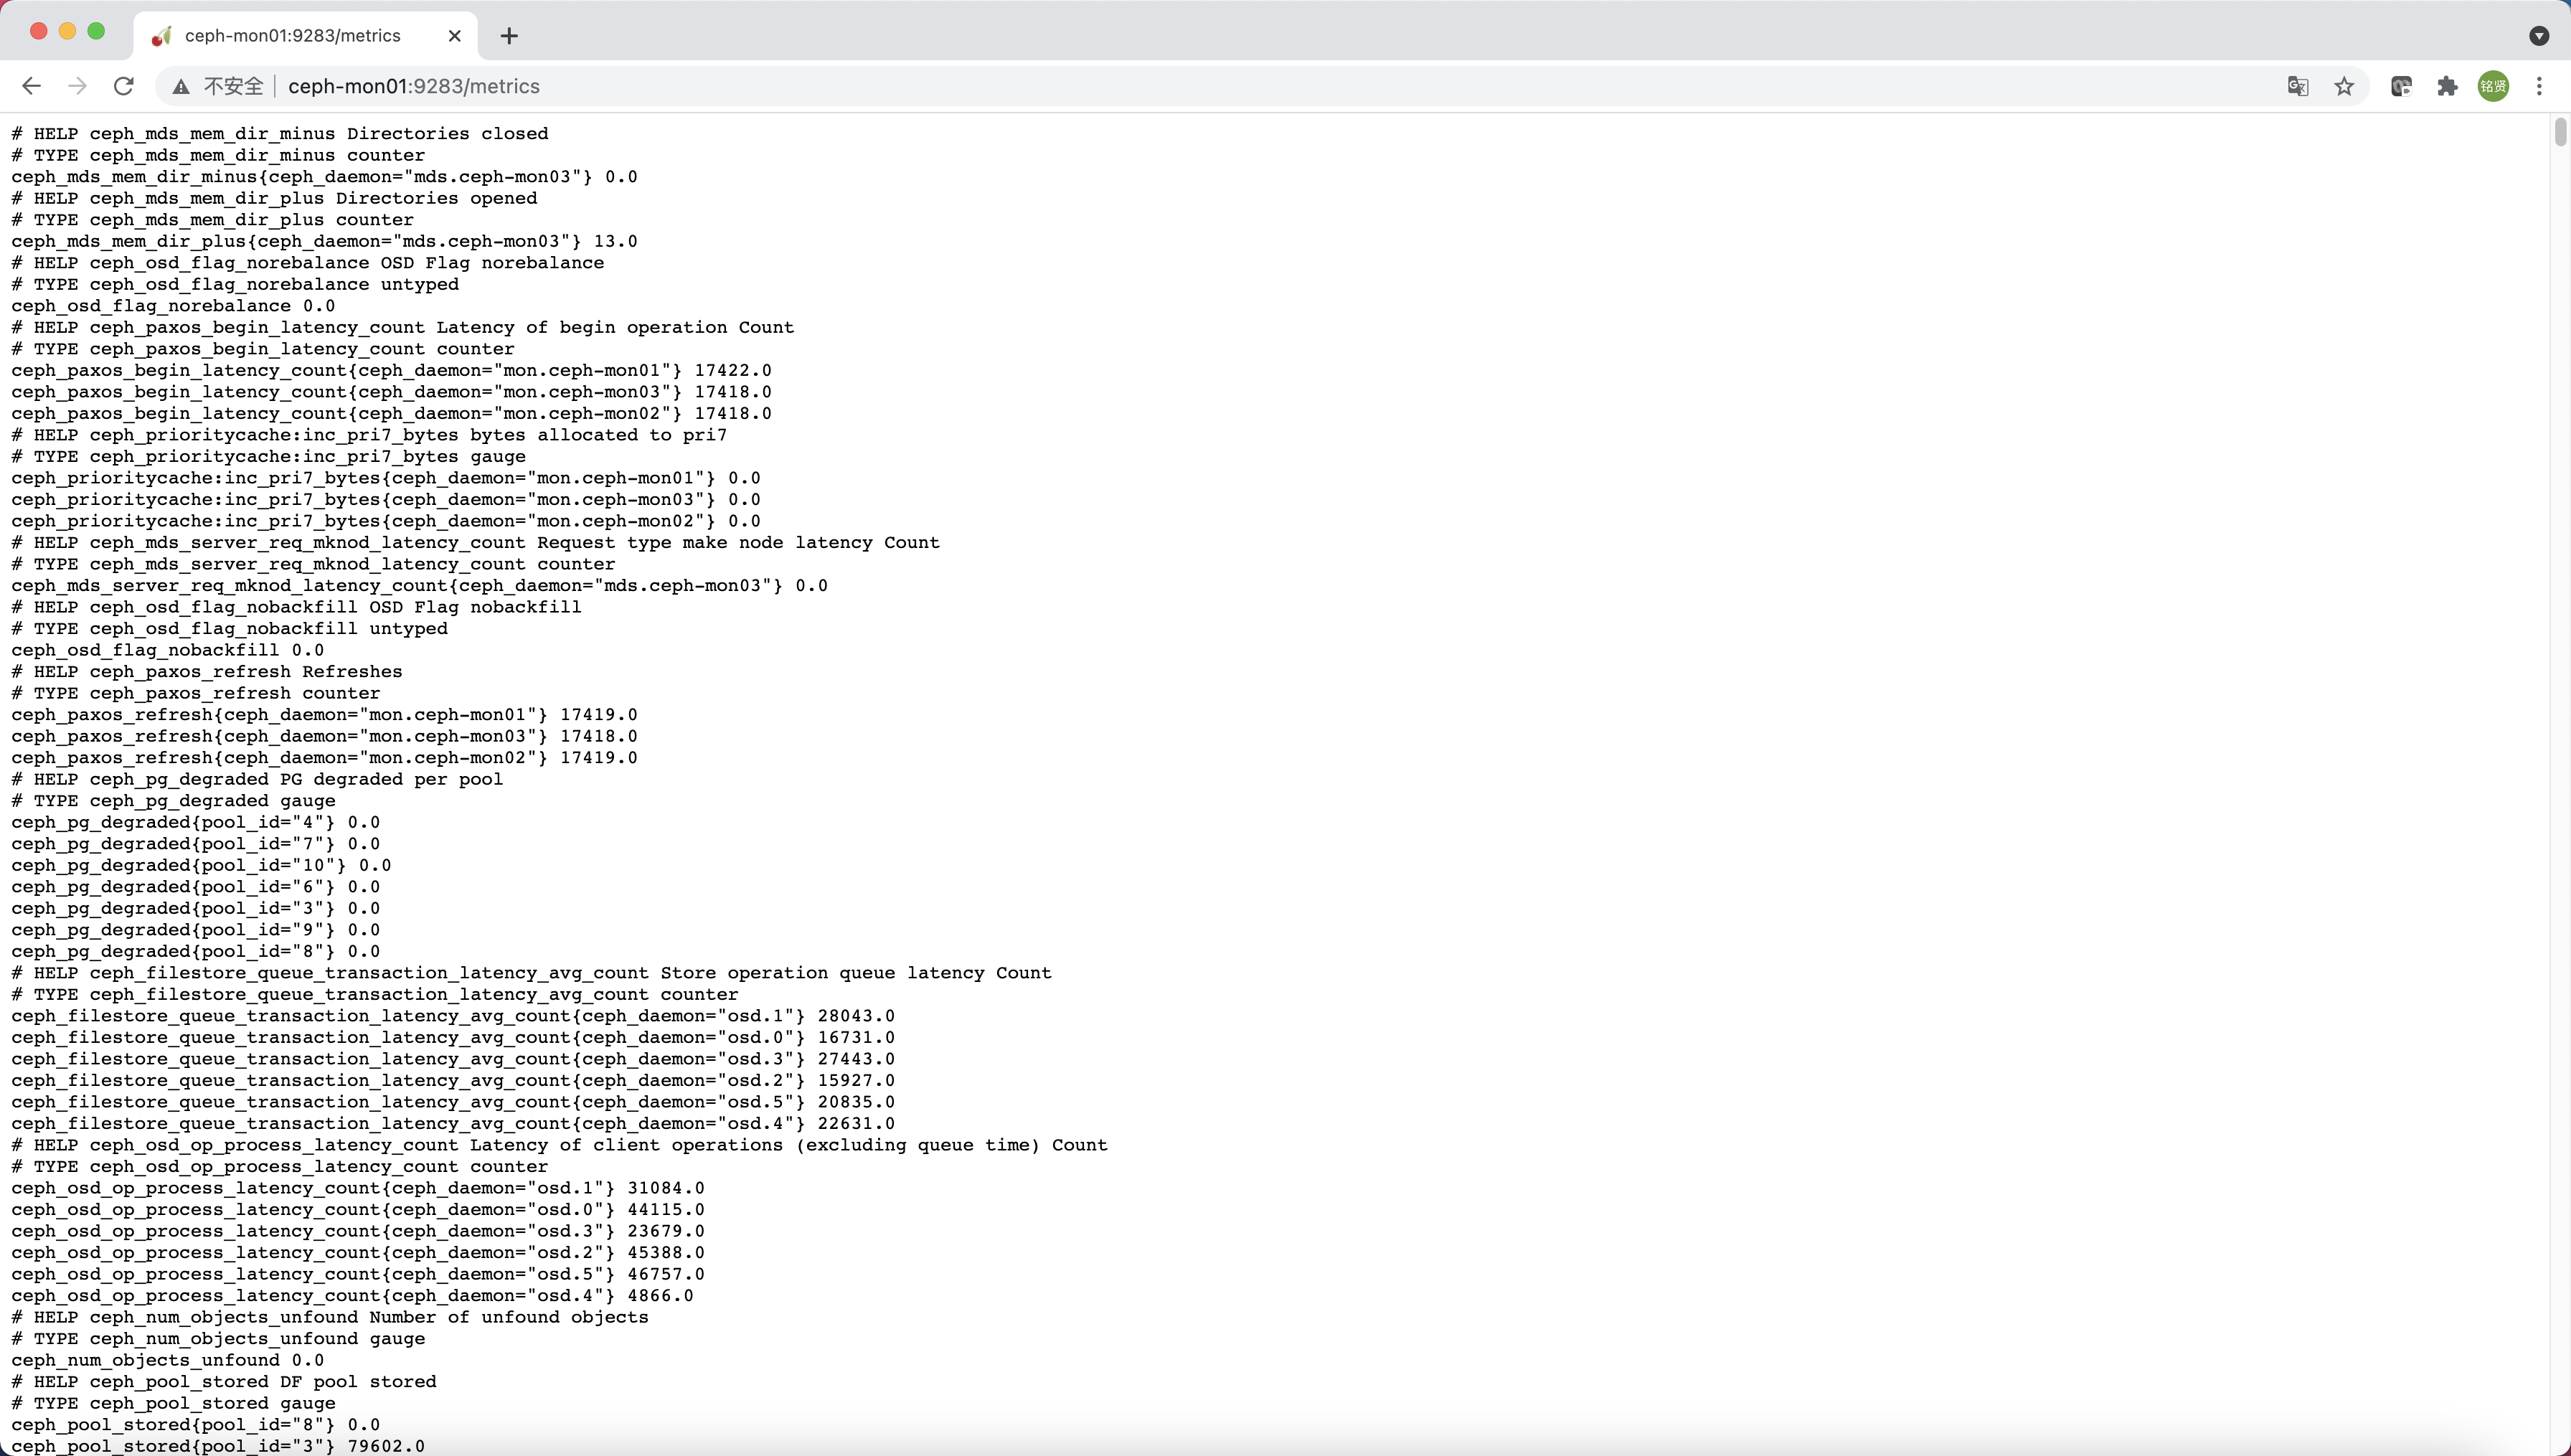
其中9283是ceph_exporter的监听端口,访问http://<MGR>:9283/metrics可以获取到metrics
安装Prometheus Server
Prometheus基于Golang编写,编译后的软件包,不依赖于任何的第三方依赖。只需要下载对应平台的二进制包,解压并且添加基本的配置即可正常启动Prometheus Server。
二进制包安装
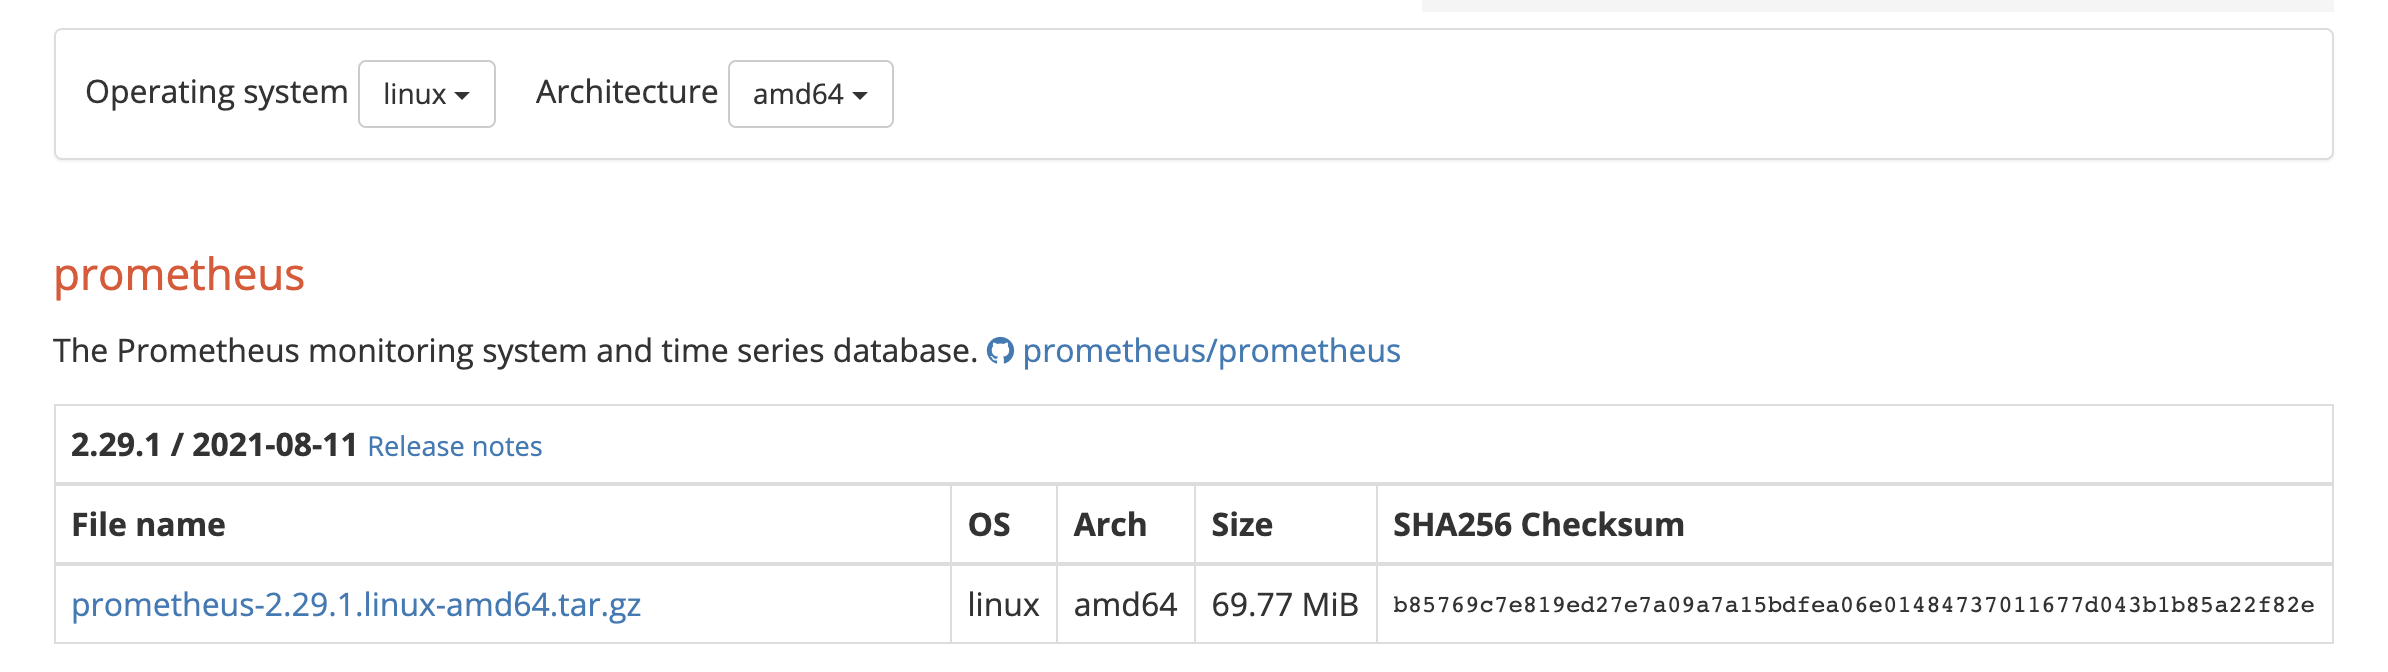
对于非Docker环境,可以在https://prometheus.io/download/根据操作系统和架构类型找到最新版本的Prometheus Server安装包。
解压到/opt/目录,解压出来的目录中包含Prometheus二进制文件、promtools二进制文件和默认的Prometheus配置文件prometheus.yml
1 | tar zxf prometheus-2.29.1.linux-amd64.tar.gz -C /opt/ |
Prometheus作为一个时间序列数据库,其采集的数据会以文件的形式存储在本地中,默认的存储路径为/data/,当启动Prometheus时会自动创建。也可以通过--storage.tsdb.path参数修改本地数据存储的路径
配置Prometheus作为系统服务进行管理
1 | cat > /usr/lib/systemd/system/prometheus.service << EOF |
ExecStart为启动Prometheus的具体命令,需要确保二进制文件和配置文件路径与实际环境一致。若需进行其他参数的自定义配置,直接将参数追加到命令最后即可。以下为几个常用的配置参数:
| 参数 | 作用 |
|---|---|
--config.file=prometheus.yml |
指定配置文件 |
--web.listen-address=0.0.0.0:9090 |
指定监听地址和端口 |
--log.level=info |
设置日志级别 |
--alertmanager.timeout=10s |
设置与报警组件的超时时间 |
--storage.tsdb.path=/data/ |
指定数据目录 |
--storage.tsdb.retention.time=15d |
设置数据保存时间,默认15天 |
--web.enable-lifecycle |
开启热加载功能 |
启动Prometheus服务
1 | systemctl daemon-reload |
正常情况下,如果启动成功通过systemctl status prometheus可以看到以下输出内容,关键信息为Server is ready to receive web requests.
1 | ● prometheus.service - prometheus |
容器安装
容器安装的方式需先安装Docker环境,首先先配置docker-ce repository
1 | # 安装所需要的包,yum-utils提供了yum-config-manager工具,device-mapper-persistent-data和lvm2是设备映射存储驱动所需要的 |
说明
若无法访问国外网站,可配置国内阿里云的docker源
配置好Docker仓库后,执行如下命令安装最新版Docker
1 | # 安装最新版本的docker-ce |
说明
若要安装指定版本的docker,按照如下步骤
2
3
4
5
yum list docker-ce --showduplicates | sort -r
# 确认好要安装的版本,例如为18.09.9,则替换yum install docker-ce-<VERSION_STRING> docker-ce-cli-<VERSION_STRING> containerd.io > -y中的<VERSION_STRING>进行安装
例如:yum install docker-ce-18.09.9 docker-ce-cli-18.09.9 containerd.io -y
启动Docker并设置开机自启
1 | systemctl start docker |
设置阿里云镜像加速器(可选)
1 | mkdir -p /etc/docker |
在https://prometheus.io/download/根据操作系统和架构类型找到最新版本的Prometheus Server安装包。
解压,将解压目录中的Prometheus配置文件prometheus.yml拷贝到/opt/prometheus目录中
1 | tar zxf prometheus-2.29.1.linux-amd64.tar.gz |
使用Prometheus的镜像启动Prometheus Server,将宿主机文件系统中的prometheus.yml文件挂载到容器中的/etc/prometheus/prometheus.yml,使用容器数据卷实现Prometheus数据持久化存储到宿主机上并设置容器名称为prometheus(便于后续对容器进行重启等操作)
1 | docker run -d --restart=always --name=prometheus -p 9090:9090 -v /opt/prometheus/data:/prometheus -v /opt/prometheus/prometheus.yml:/etc/prometheus/prometheus.yml prom/prometheus:v2.29.1 |
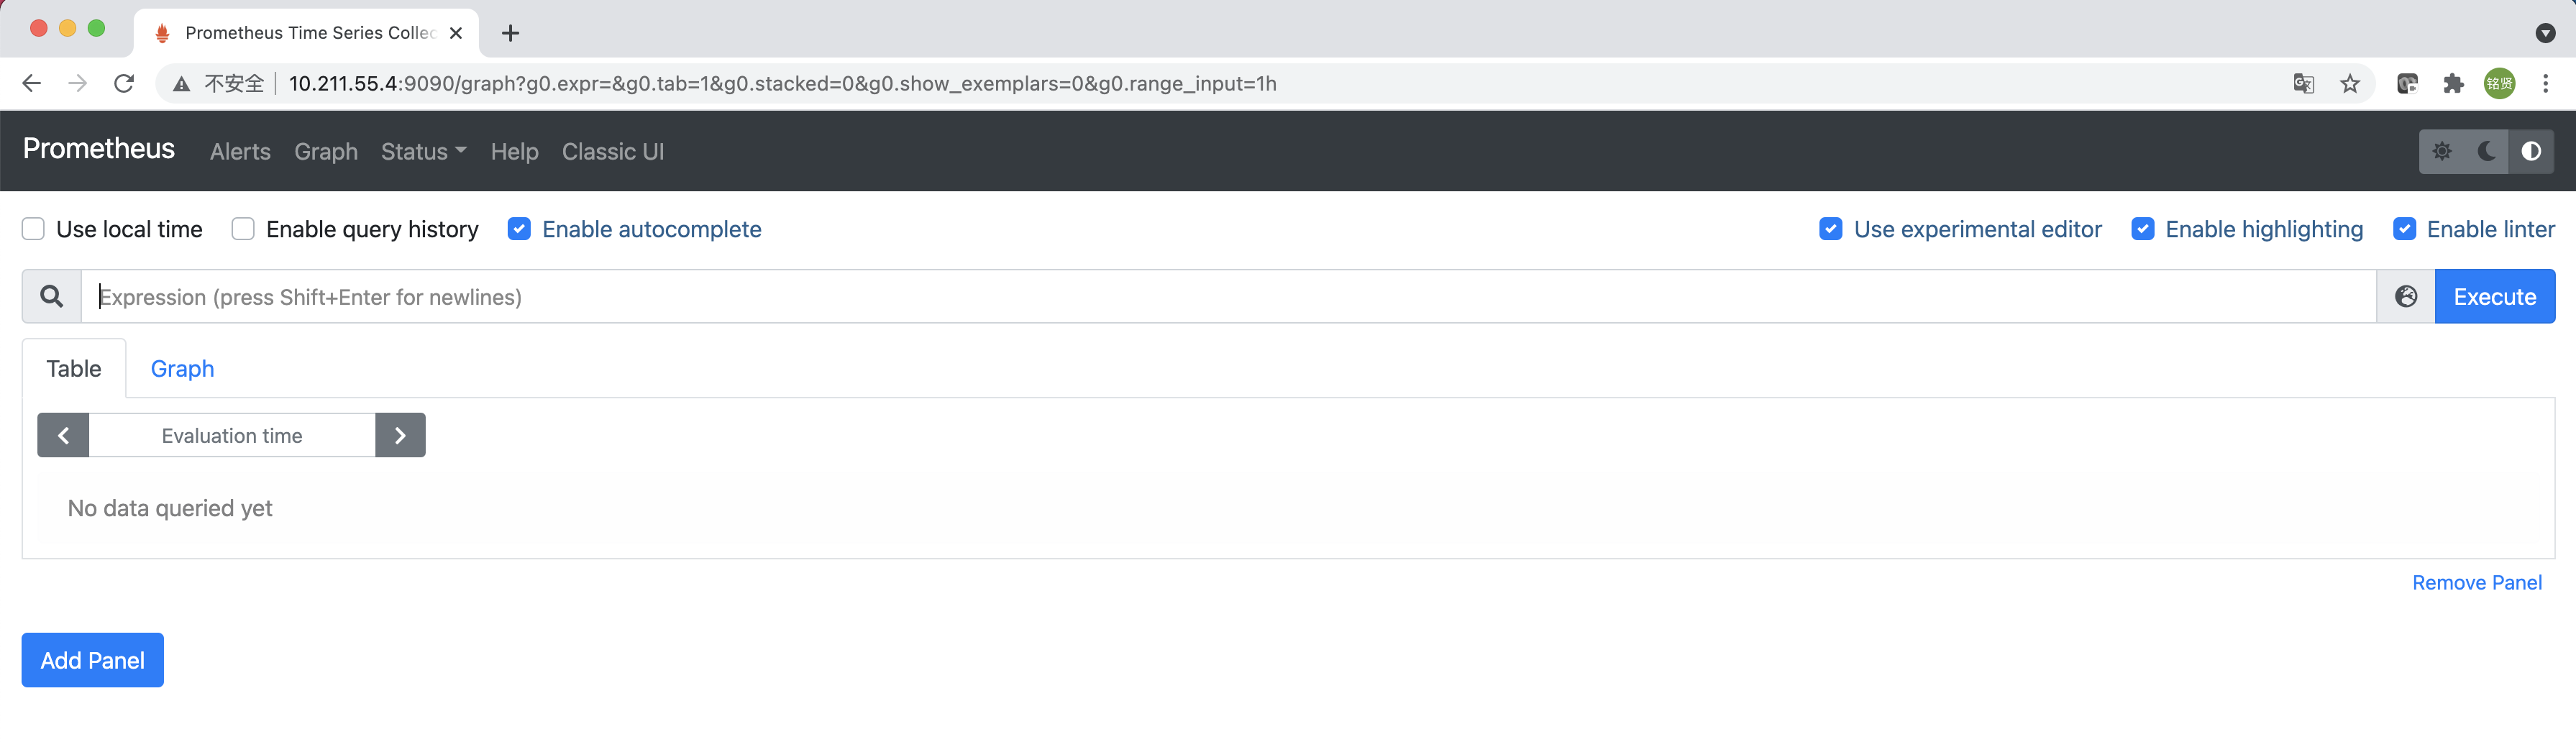
访问Portal
启动完成后,可以通过http://<IP>:9090访问Prometheus的UI界面
从Ceph Exporter收集监控数据
为了让Prometheus Server能够从Ceph Exporter获取到监控数据,需要修改Prometheus配置文件。编辑prometheus.yml并在scrape_configs节点下添加以下内容:
1 | scrape_configs: |
重新热加载prometheus配置
1 | systemctl reload prometheus |
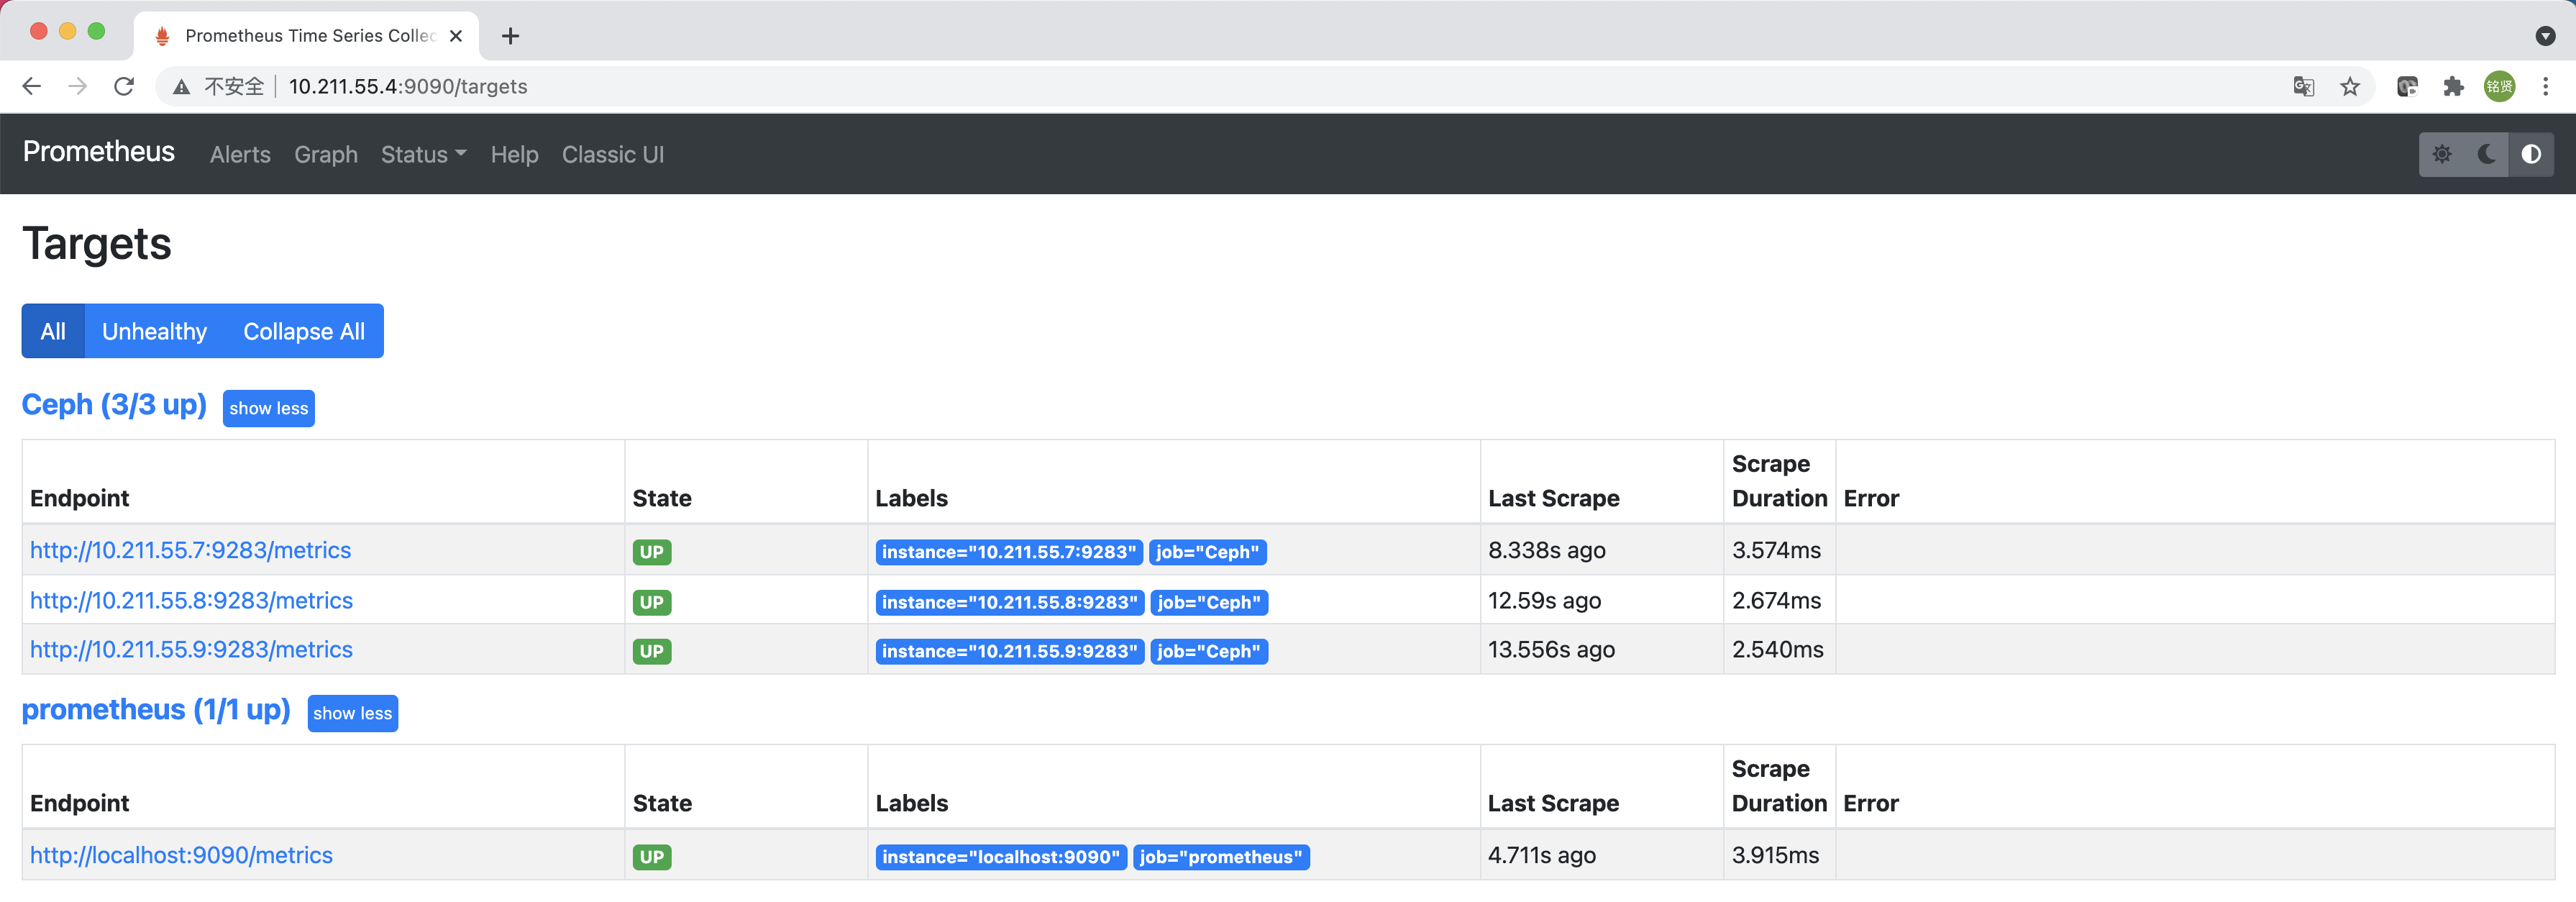
访问http://<IP>:9090访问Prometheus的UI界面,选择"Status"->"Targets",如果Prometheus能够正常从Ceph Exporter获取数据,可以看到targets的State为UP
安装Grafana
官网安装文档:https://grafana.com/docs/grafana/latest/setup-grafana/installation/
RPM包安装
配置Grafana OSS releases Yum源
1 | cat > /etc/yum.repos.d/grafana.repo << EOF |
安装Grafana
1 | yum install grafana -y |
启动Grafana
1 | systemctl daemon-reload |
容器安装
直接使用Grafana镜像启动即可
1 | docker run -d --restart=always -p 3000:3000 --name grafana grafana/grafana:8.1.1 |
配置Grafana
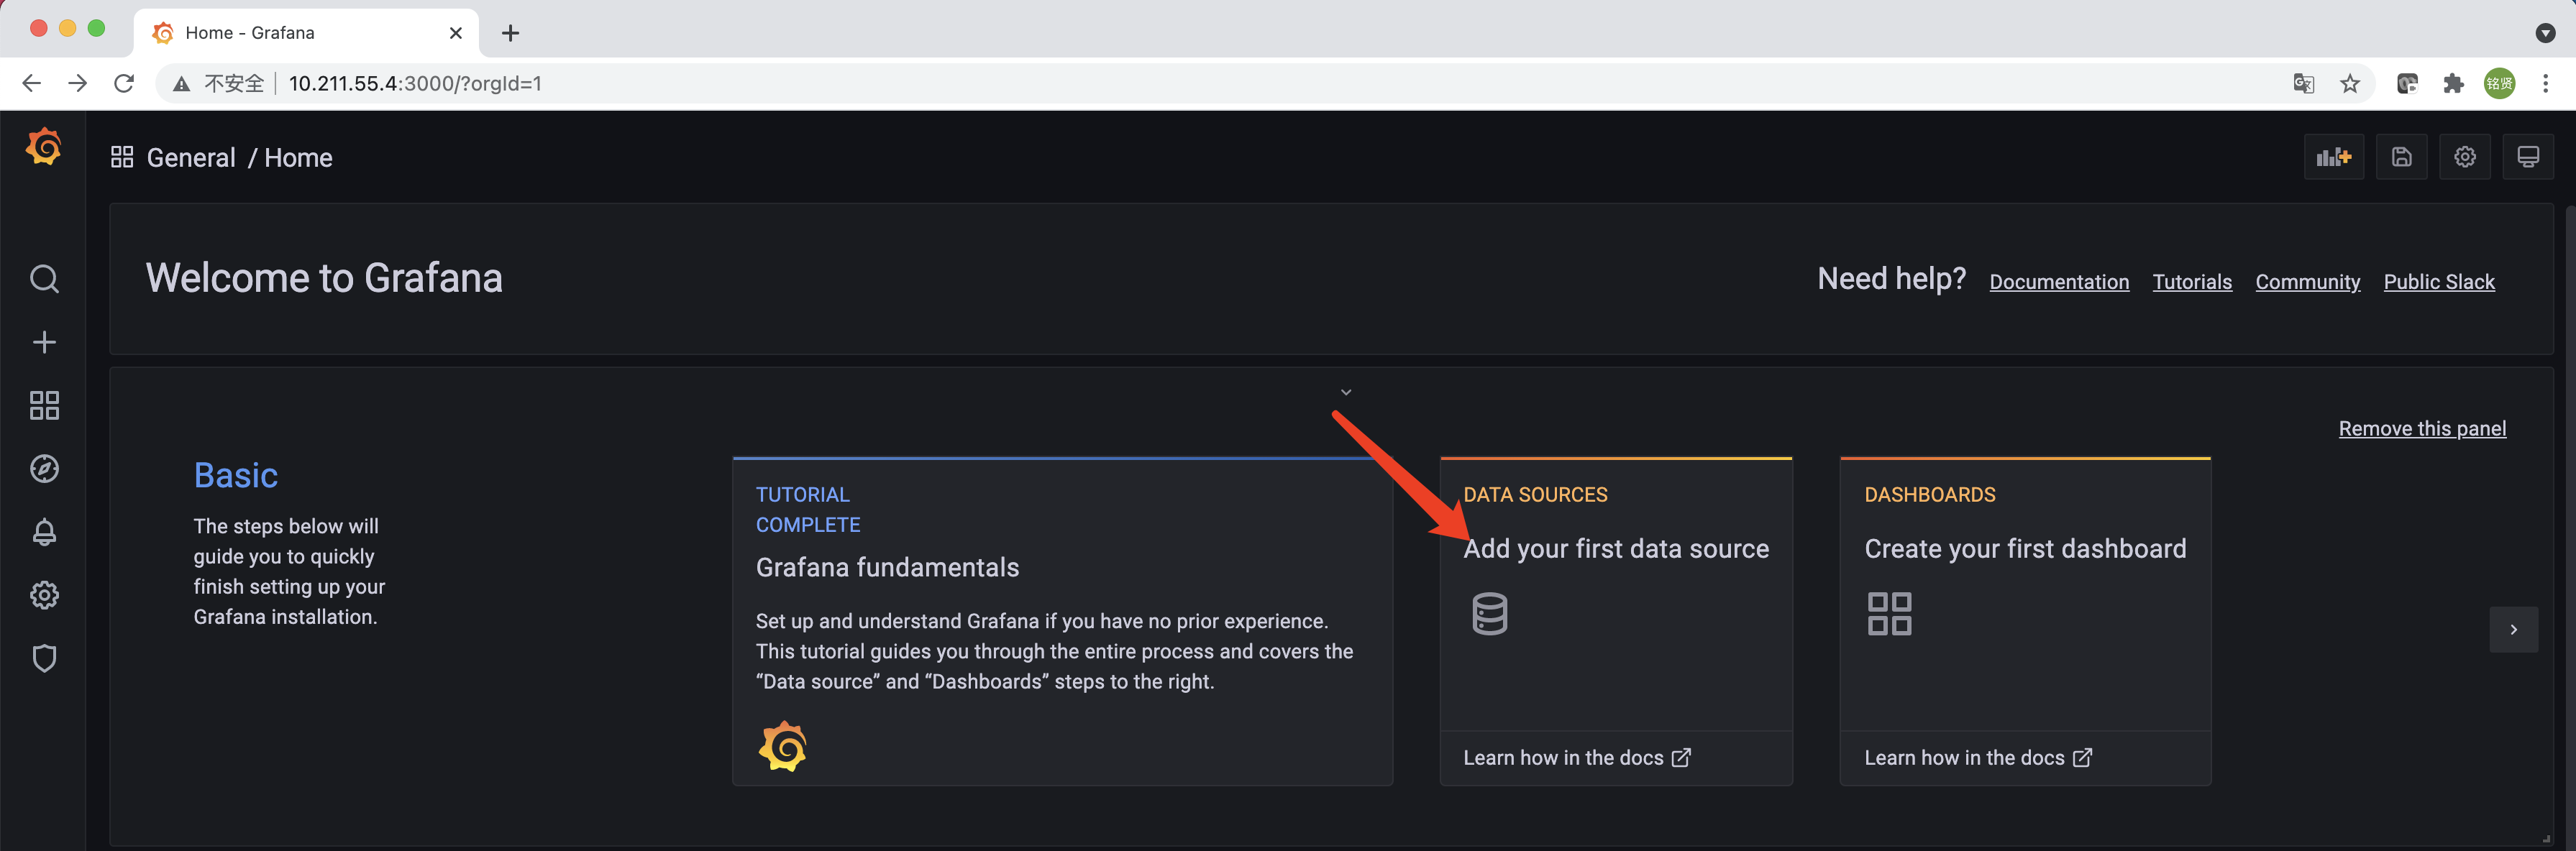
安装完成后访问http://<IP>:3000就可以进入到Grafana的界面中,默认情况下使用账户admin/admin进行登录(首次登录会要求修改默认密码)。单击"Add your first data source"添加数据源
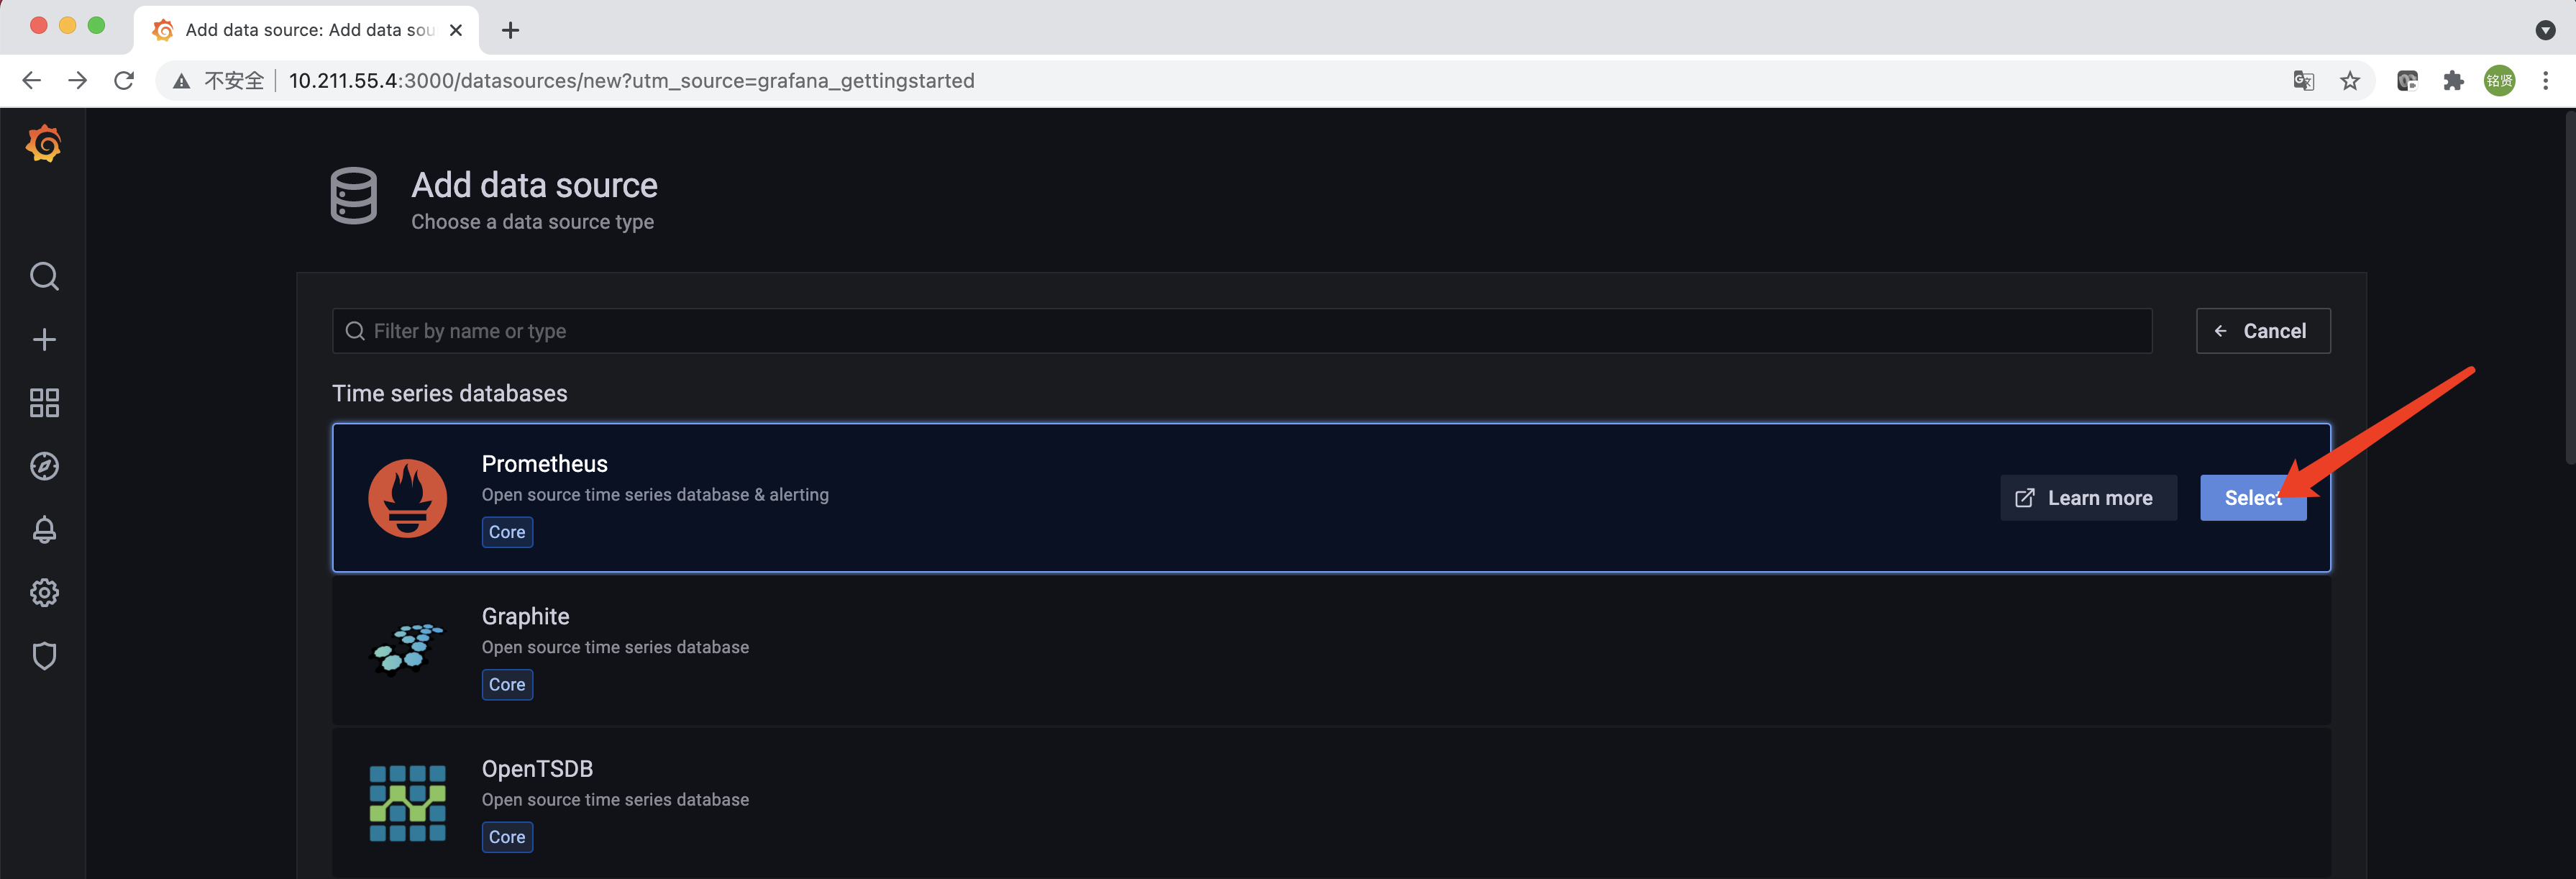
选择“Prometheus”,单击右侧的“Select”
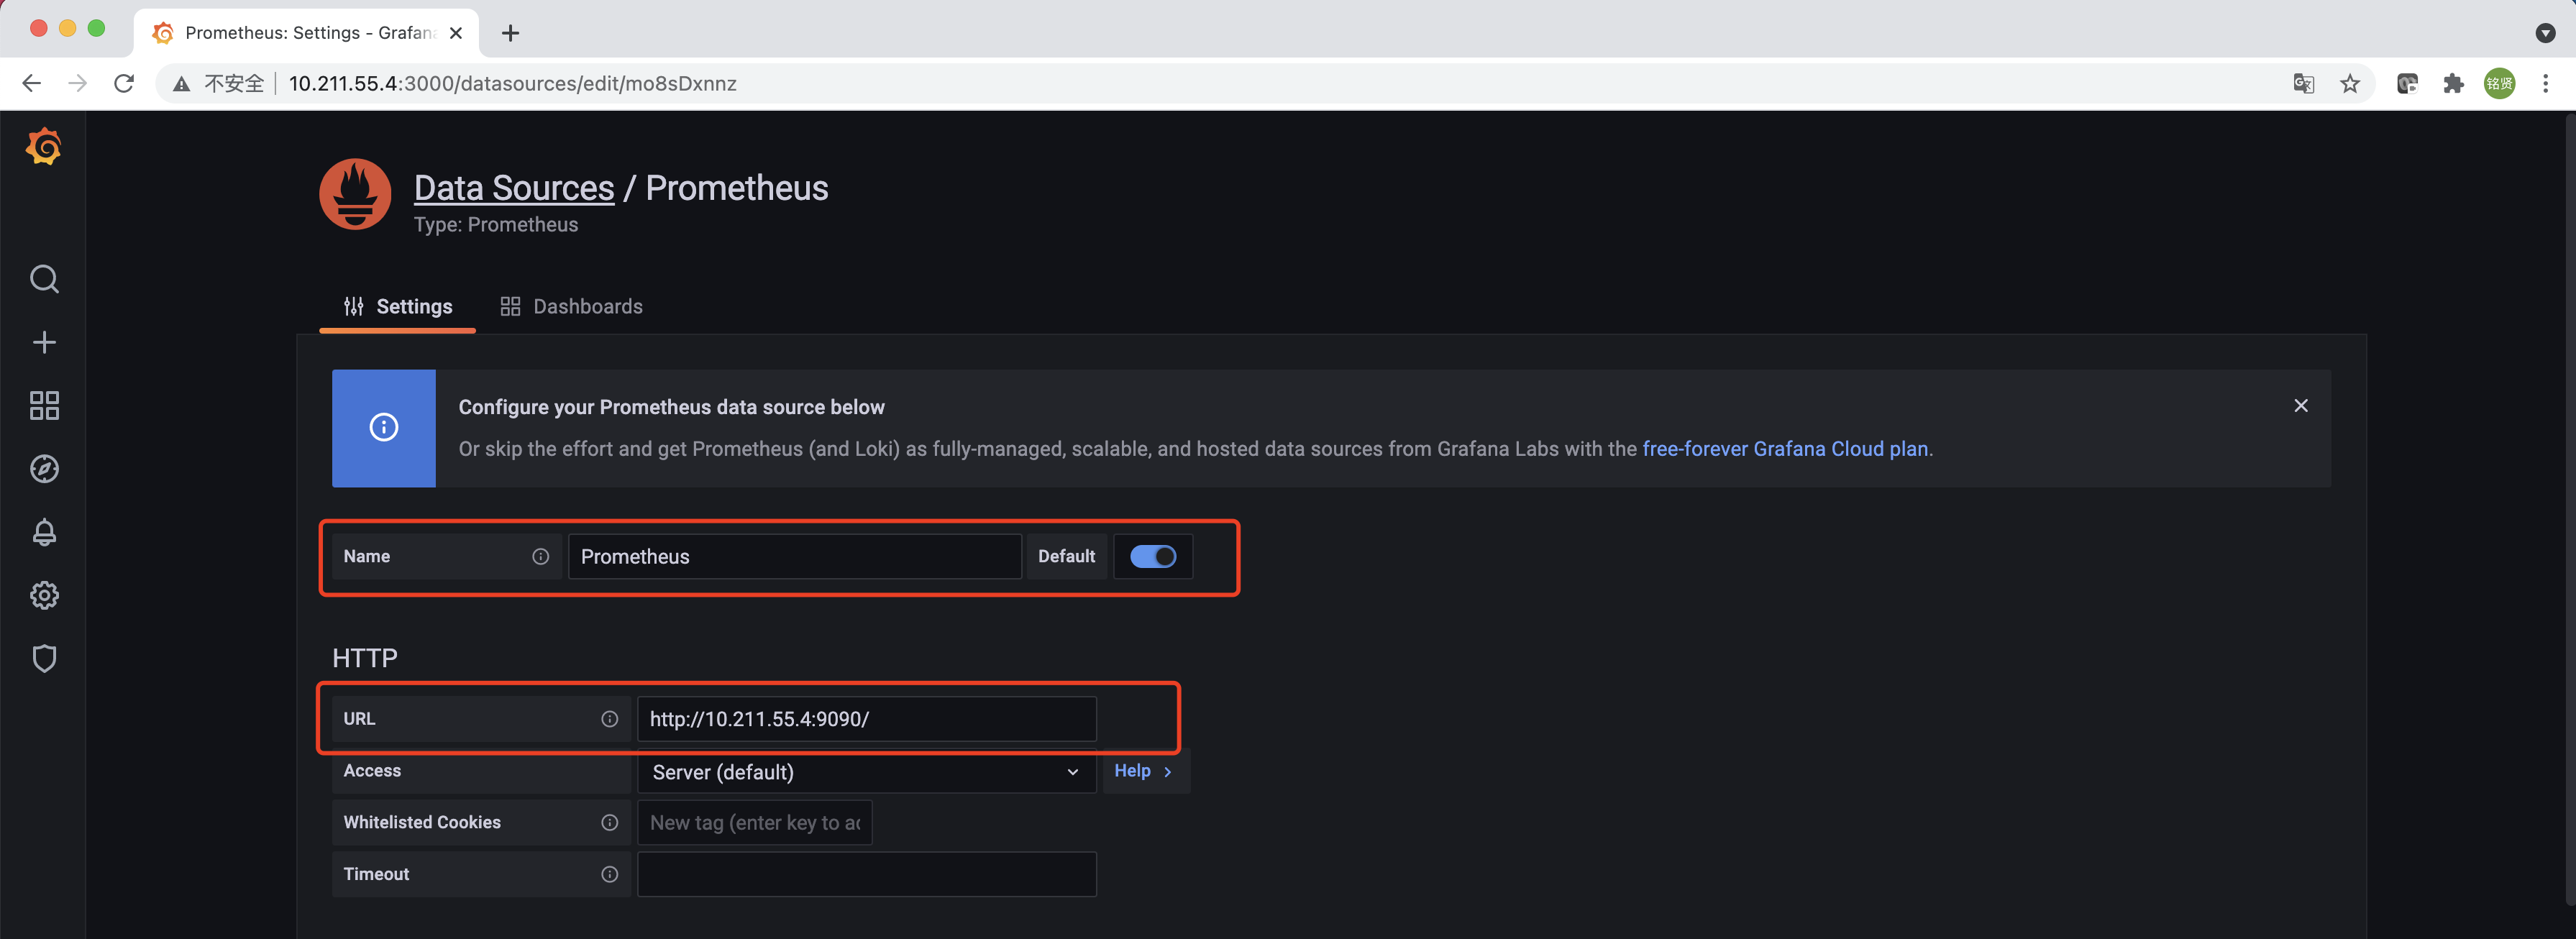
配置“Name”,勾选“Default”,“URL”填写Prometheus的访问地址,滑到最下方单击“Save & test”完成添加,配置正确的情况下会提示"Data source is working"的信息。
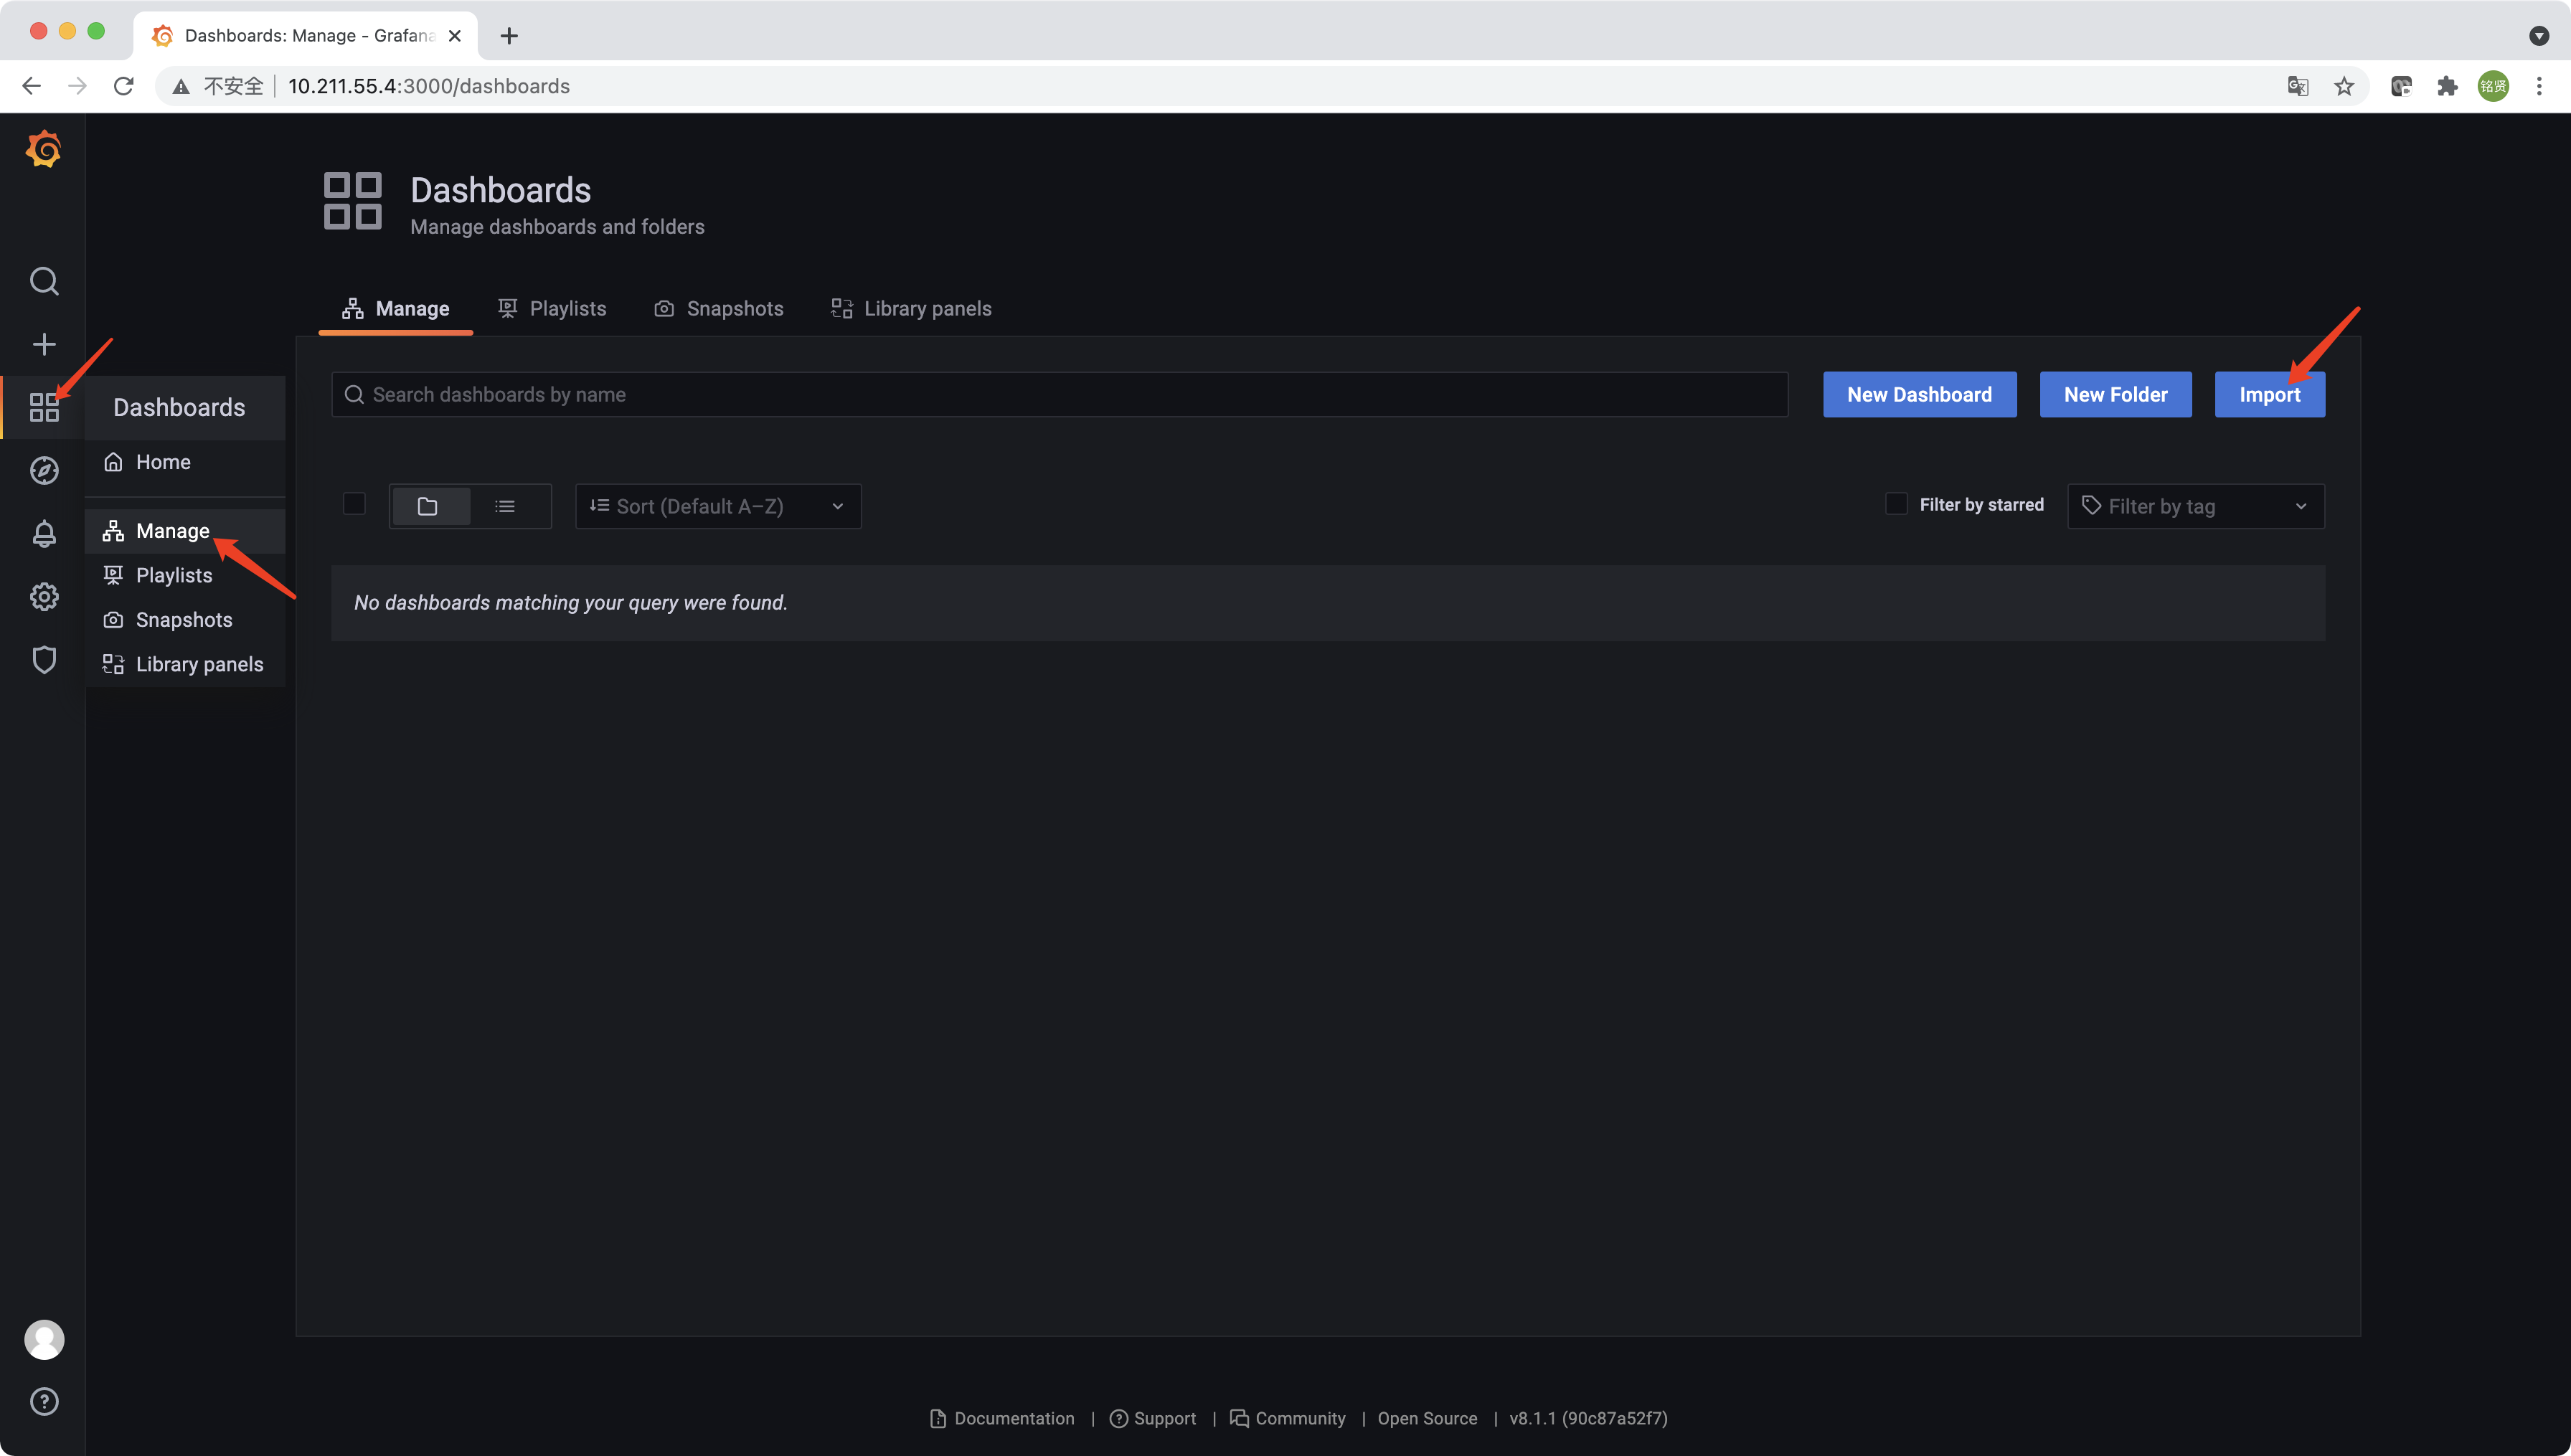
在完成数据源的添加之后就可以在Grafana中创建可视化Dashboard了,选择左侧的“Dashboards”->“Manage”,单击“Import”
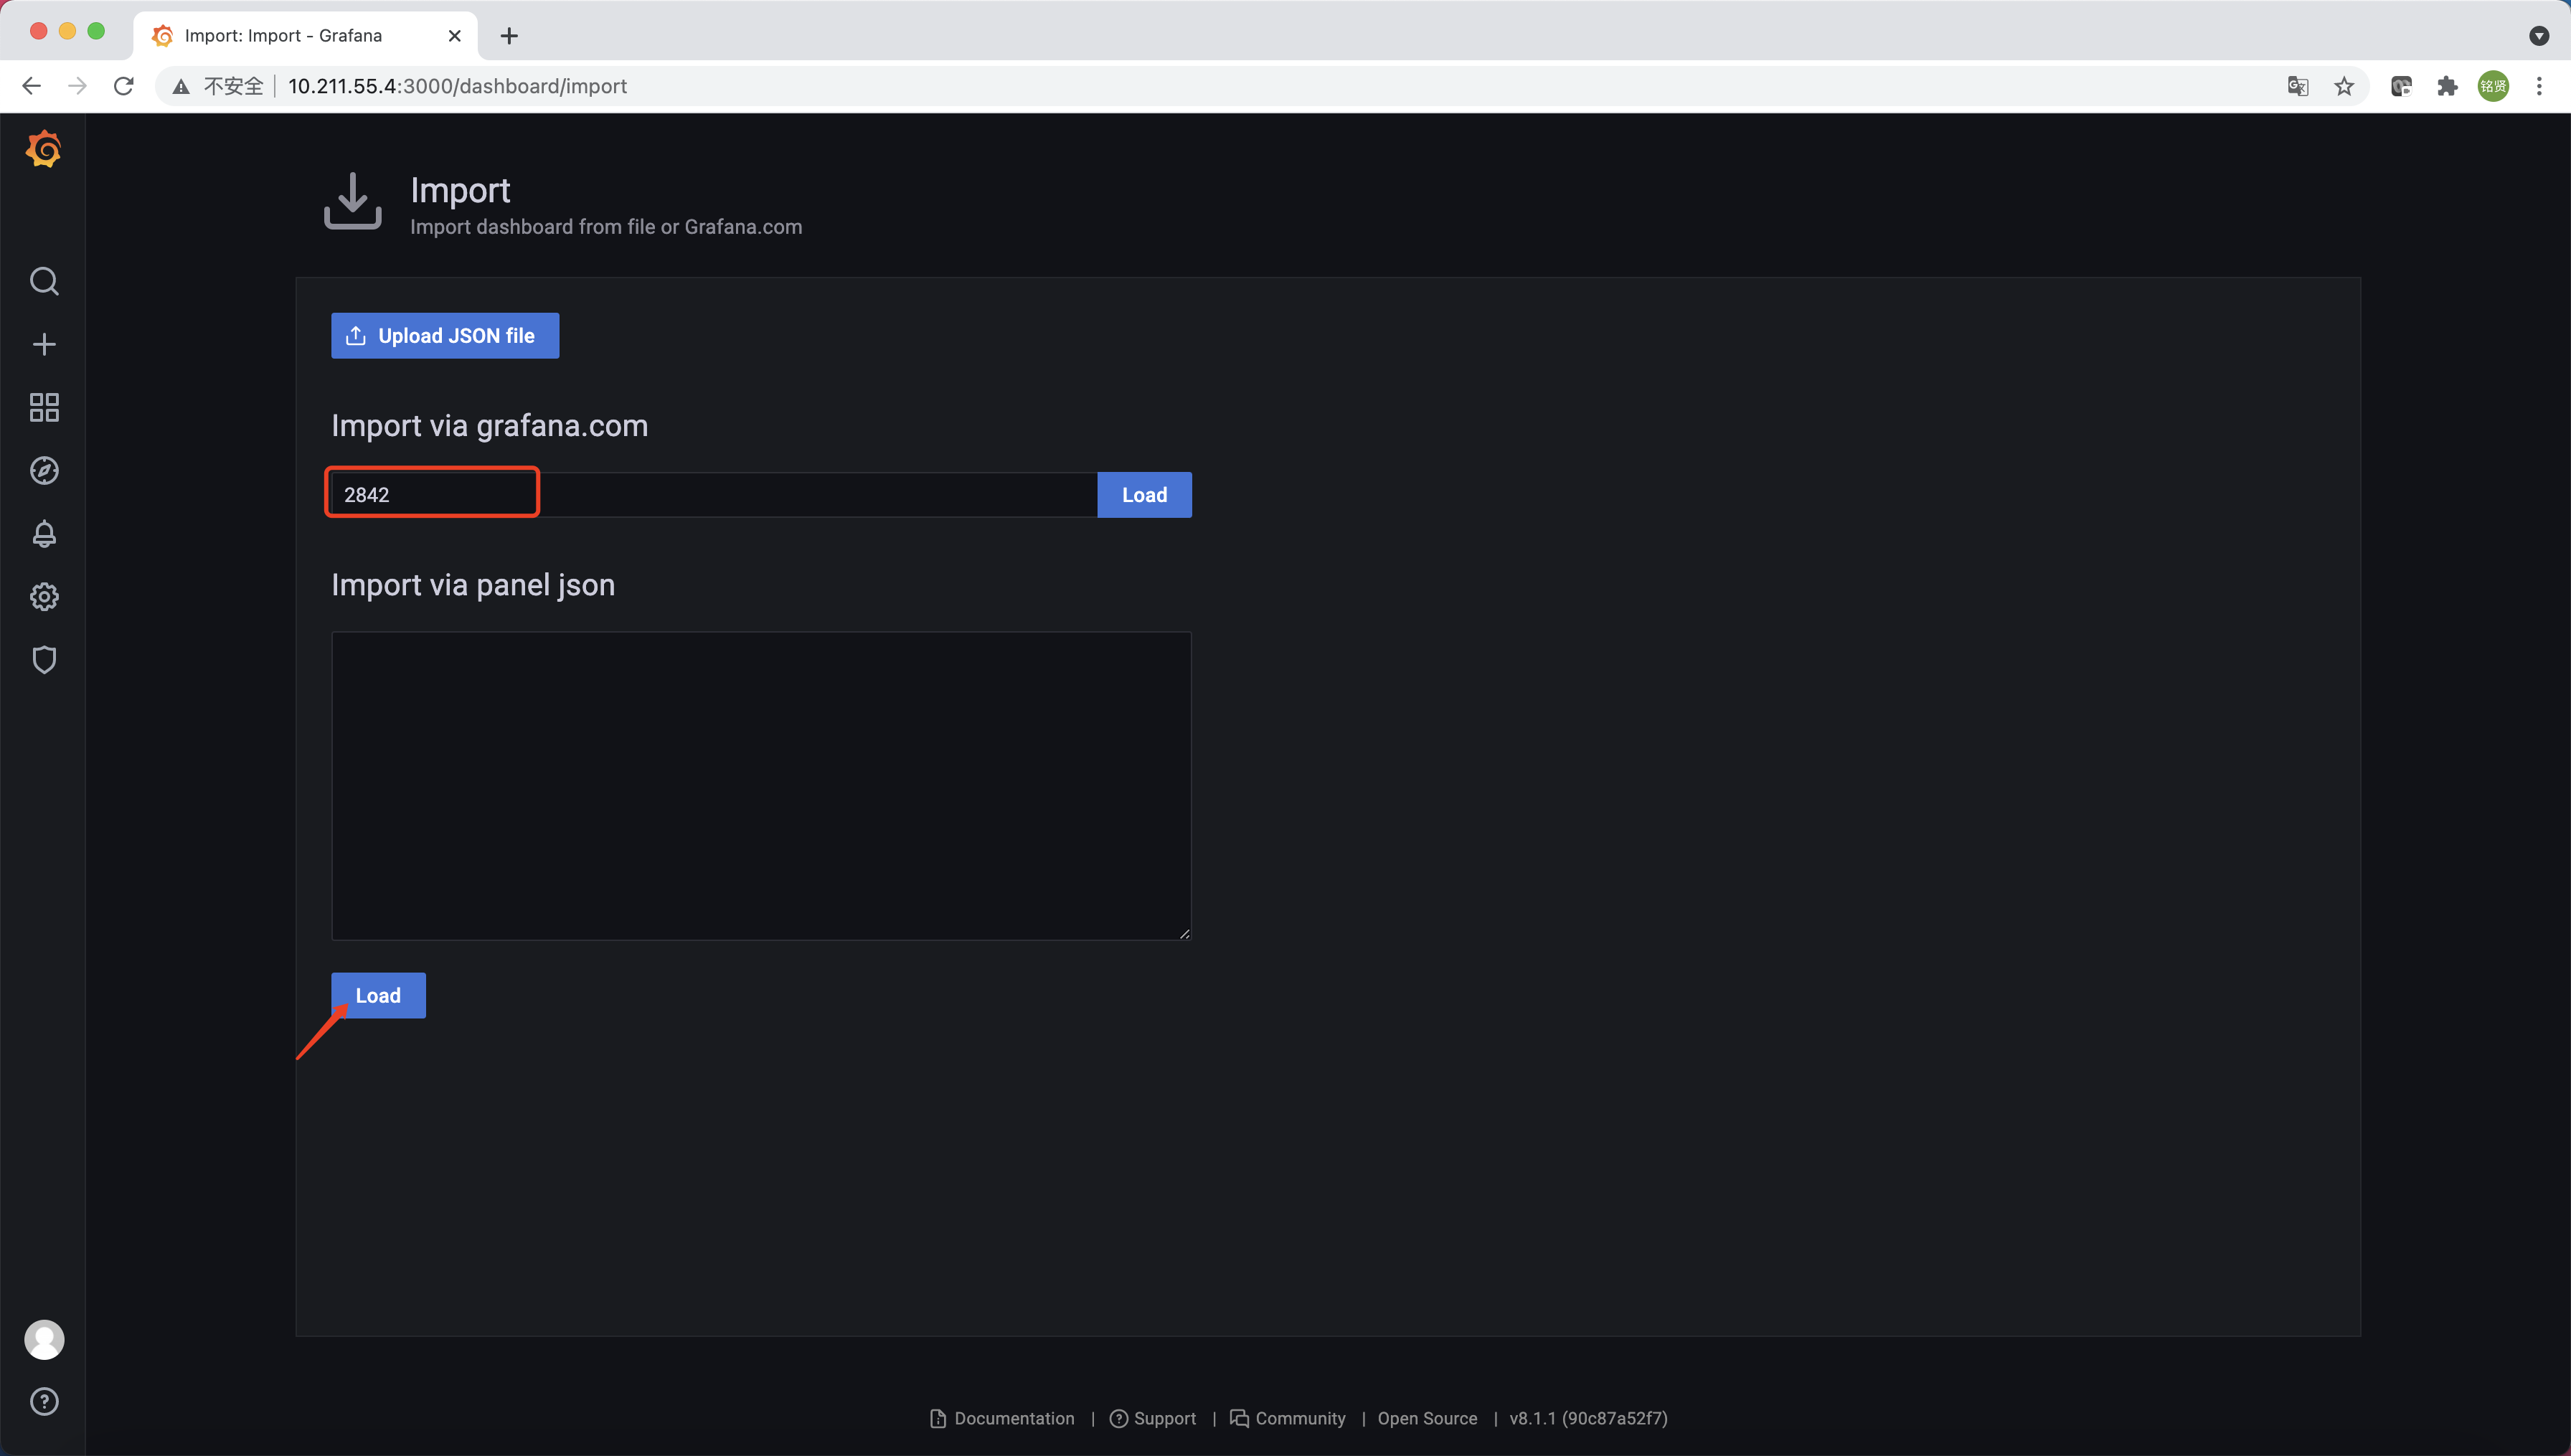
输入Dashboard模板编号2842,单击“Load”
说明
也可以下载Dashboard模板的json文件然后单击“Upload JSON file”上传
给Dashboard配置个名称,选择数据源为Prometheus,最后单击“Import”
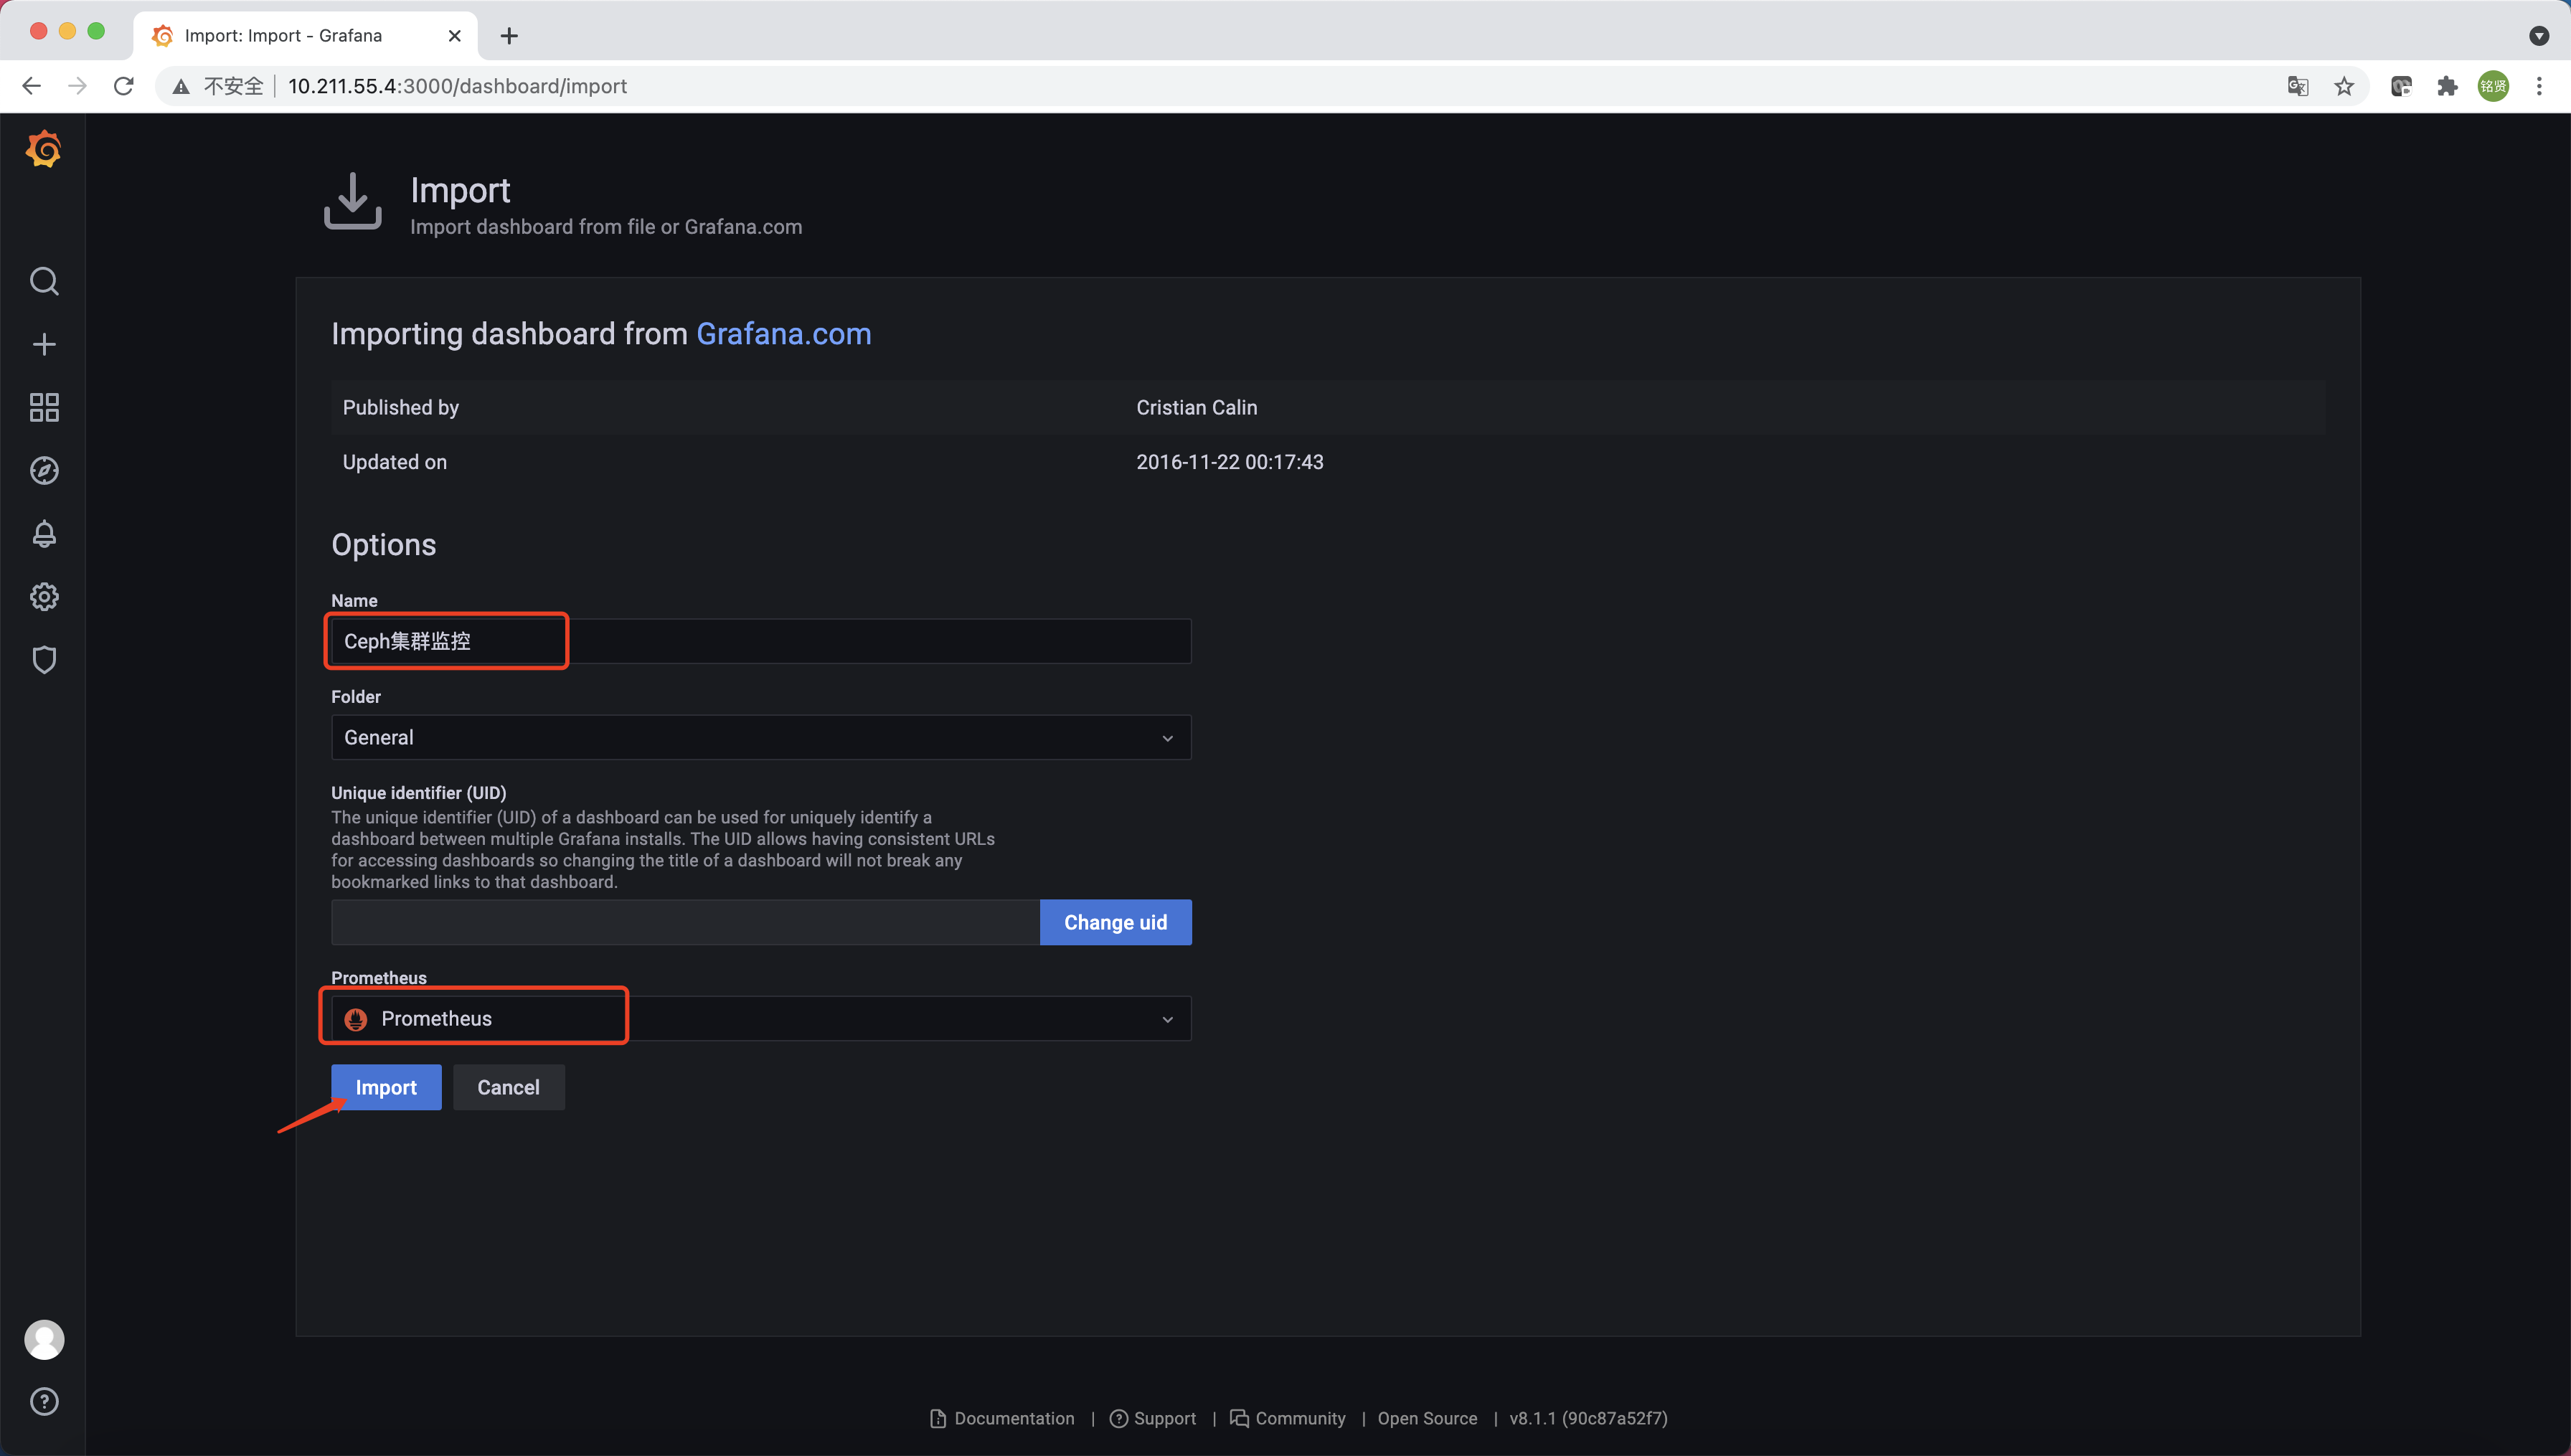
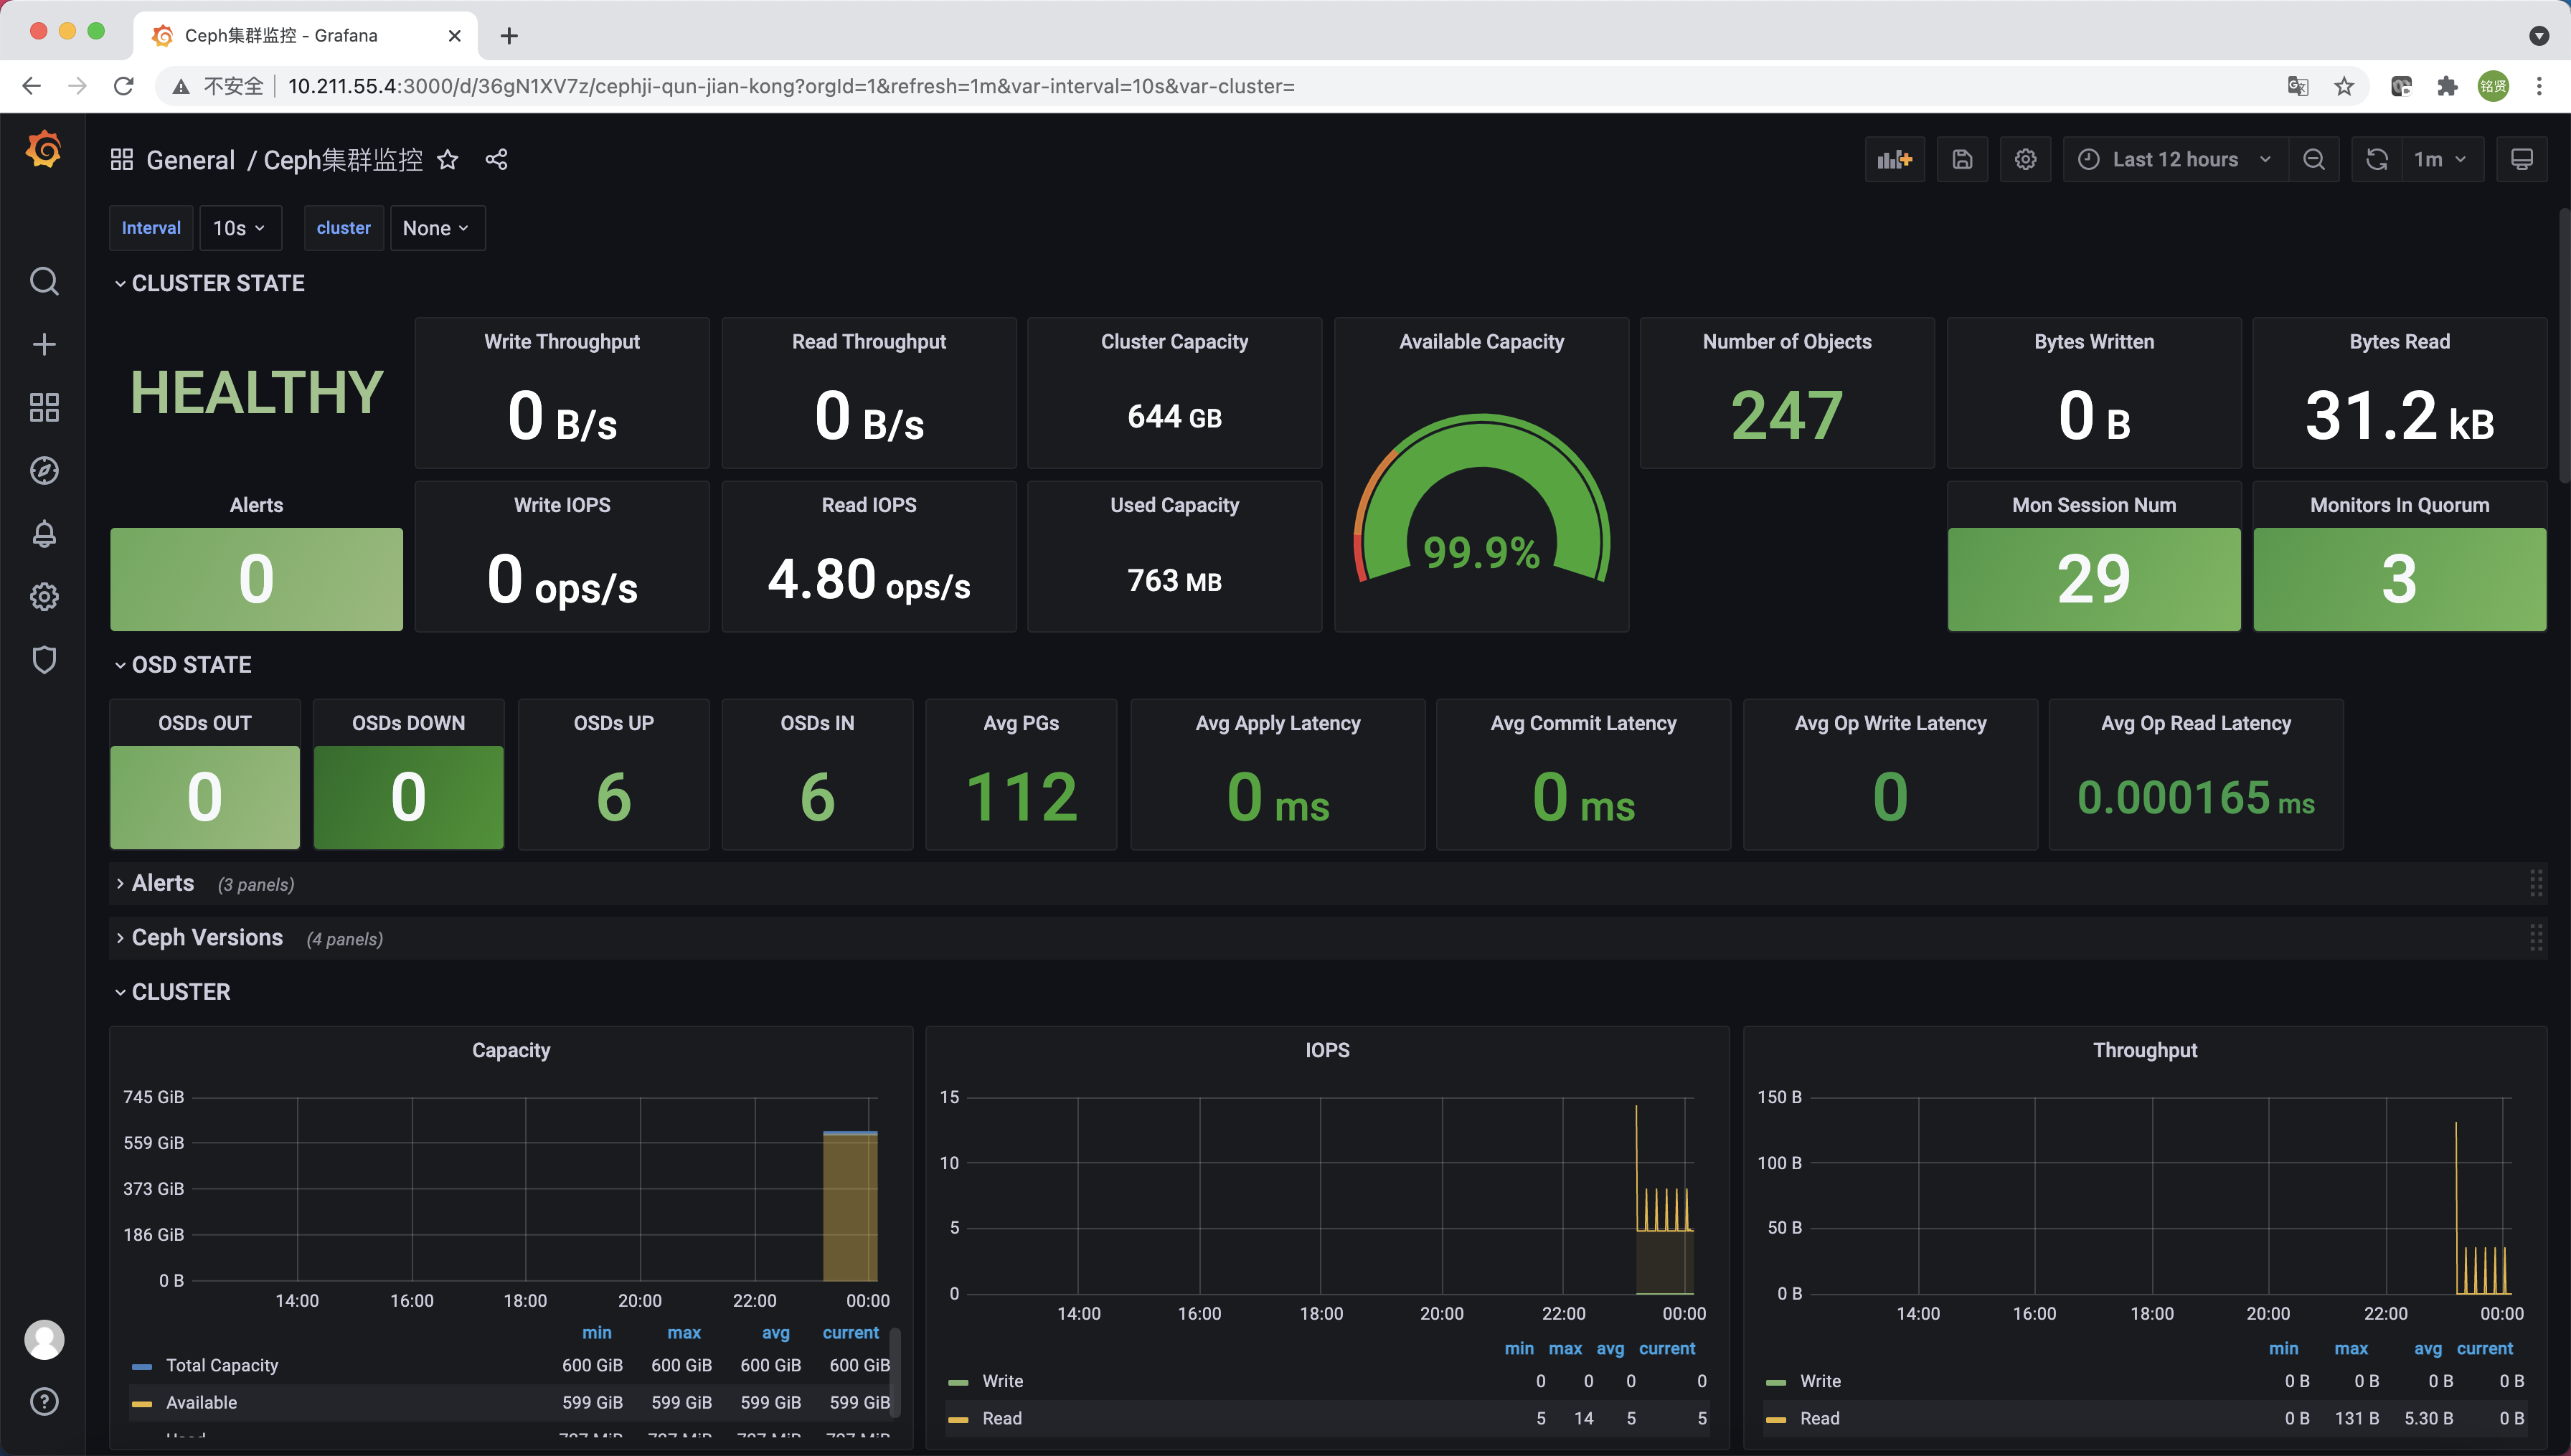
导入完成后Ceph集群的监控信息将清晰的展示在Dashboard中。