初识Prometheus
Prometheus简介
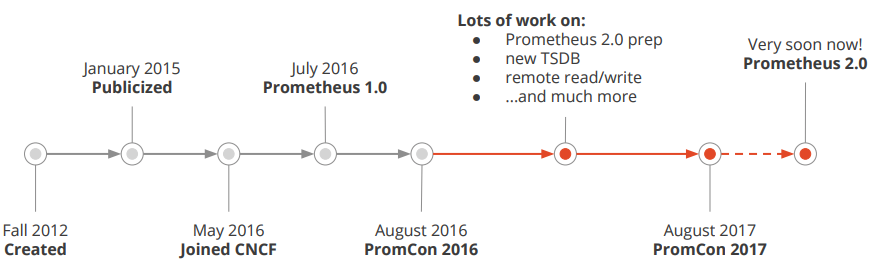
Prometheus受启发于Google的Brogmon监控系统(相似的Kubernetes是从Google的Brog系统演变而来),从2012年开始由前Google工程师在Soundcloud以开源软件的形式进行研发,并且于2015年早期对外发布早期版本。2016年5月继Kubernetes之后成为第二个正式加入CNCF基金会的项目,同年6月正式发布1.0版本。2017年底发布了基于全新存储层的2.0版本,能更好地与容器平台、云平台配合。
- 官方网站:https://prometheus.io/
- Github仓库:https://github.com/prometheus
功能特征
- 多维数据模型(由度量名称和键值对标识的时间序列数据)
- PromQL:一种强大且灵活的查询语言,可以利用多维数据完成复杂的查询
- 不依赖分布式存储,单个服务器节点可直接工作
- 基于HTTP的pull模式采集时间序列数据。
- 可以使用pushgateway(prometheus的可选中间件)实现push模式。
- 可以使用动态服务发现或静态配置发现目标。
- 支持多种图形及仪表盘。
- 支持分层与水平联合
Prometheus架构

Prometheus Server
Prometheus Server是监控系统的服务端,服务端通过服务发现的方式,抓取被监控服务的指标,或者通过pushgateway的间接抓取,抓取到指标数据后,通过特定的存储引擎进行存储,同时暴露一个HTTP服务,提供用 PromQL来进行数据查询。注意,Prometheus是定时采样数据,而不是全量数据。
Exporter
Prometheus需要服务暴露http接口,如果服务本身没有,我们不需要改造服务,可以通过exporter来间接获取。Exporter就充当了Prometheus采集的目标,而由各个exporter去直接获取指标。目前大多数的服务都有现成的exporter,我们不需要重复造轮子,拿来用即可,如MySQL,MongoDB等,可以参考这里。
Push Gateway
Prometheus采集指标的方式主要有两种,一种是服务端暴露接口(Exporter),由Prometheus主动去抓取指标,称为pull模式。另一种是服务端主动上报,服务端将指标主动上报至Push Gateway,Prometheus再从 Push Gateway中获取,称为push模式。而Push Gateway就是push模式中重要的中介角色,用于暂存服务端上报的指标,等待Prometheus收集。
为什么要有两种模式呢?我们来比较一下这两种模式的特点。
- Pull模式:Prometheus主动抓取的方式,可以由Prometheus服务端控制抓取的频率,简单清晰,控制权在Prometheus服务端。通过服务发现机制,可以自动接入新服务,去掉下线的服务,无需任何人工干预。对于各种常见的服务,官方或社区有大量Exporter来提供指标采集接口,基本无需开发。是官方推荐的方式。
- Push模式:由服务端主动上报至Push Gateway,采集最小粒度由服务端决定,等于Push Gateway充当了中介的角色,收集各个服务主动上报的指标,然后再由Prometheus来采集。但是这样就存在了Push Gateway这个性能单点,而且Push Gateway也要处理持久化问题,不然宕机也会丢失部分数据。同时需要服务端提供主动上报的功能,可能涉及一些开发改动。不是首选的方式,但是在一些场景下很适用。例如,一些临时性的任务,存在时间可能非常短,如果采用Pull模式,可能抓取不到数据。
Alert Manager
Alert Manager是Prometheus的报警组件,当Prometheus服务端发现报警时,推送alert到Alert Manager,再由Alert Manager发送到通知端,如Email,Slack,微信,钉钉等。Alert Manager根据相关规则提供了报警的分组、聚合、抑制、沉默等功能。
Web UI/Grafana
Prometheus提供了一个简单的web UI界面,用于查询数据,查看告警、配置等,官方推荐使用另一个开源项目grafana来做指标的可视化展示,制作仪表盘等。
安装Prometheus Server
Prometheus基于Golang编写,编译后的软件包,不依赖于任何的第三方依赖。只需要下载对应平台的二进制包,解压并且添加基本的配置即可正常启动Prometheus Server。
二进制包安装
对于非Docker环境,可以在https://prometheus.io/download/根据操作系统和架构类型找到最新版本的Prometheus Server安装包。
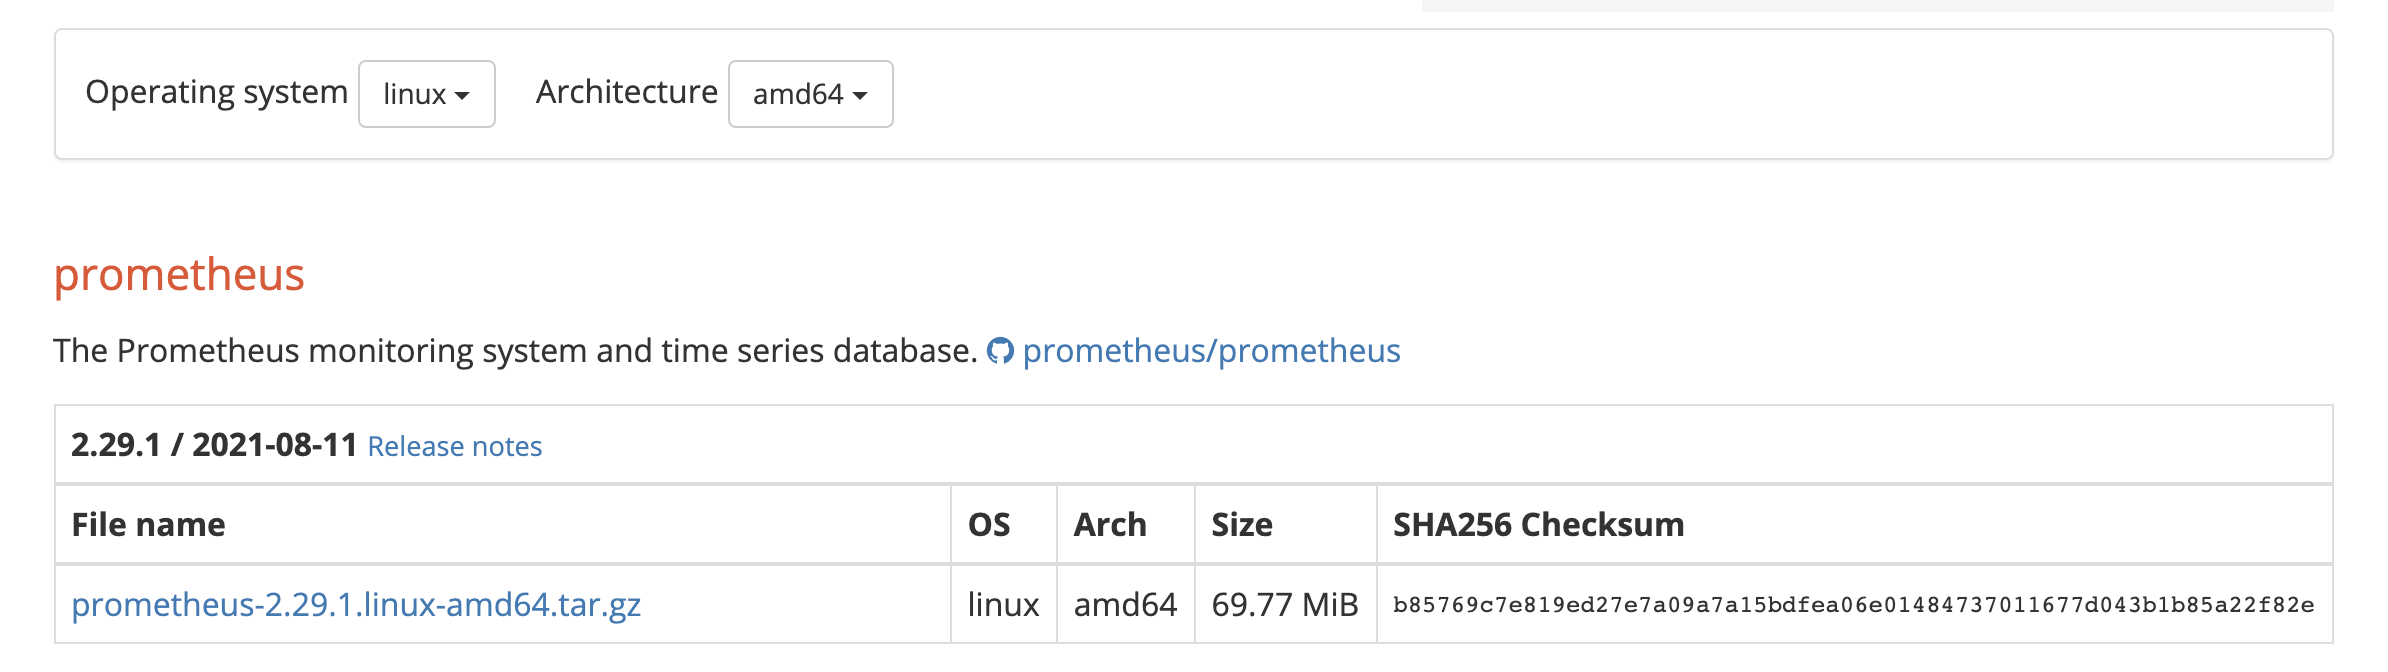
解压到/opt/目录,解压出来的目录中包含Prometheus二进制文件、promtools二进制文件和默认的Prometheus配置文件prometheus.yml
1 | tar zxf prometheus-2.29.1.linux-amd64.tar.gz -C /opt/ |
Prometheus作为一个时间序列数据库,其采集的数据会以文件的形式存储在本地中,默认的存储路径为/data/,当启动Prometheus时会自动创建。也可以通过--storage.tsdb.path参数修改本地数据存储的路径
配置Prometheus作为系统服务进行管理
1 | cat > /usr/lib/systemd/system/prometheus.service << EOF |
ExecStart为启动Prometheus的具体命令,需要确保二进制文件和配置文件路径与实际环境一致。若需进行其他参数的自定义配置,直接将参数追加到命令最后即可。以下为几个常用的配置参数:
| 参数 | 作用 |
|---|---|
--config.file=prometheus.yml |
指定配置文件 |
--web.listen-address=0.0.0.0:9090 |
指定监听地址和端口 |
--log.level=info |
设置日志级别 |
--alertmanager.timeout=10s |
设置与报警组件的超时时间 |
--storage.tsdb.path=/data/ |
指定数据目录 |
--storage.tsdb.retention.time=15d |
设置数据保存时间,默认15天 |
--web.enable-lifecycle |
开启热加载功能 |
启动Prometheus服务
1 | systemctl daemon-reload |
正常情况下,如果启动成功通过systemctl status prometheus可以看到以下输出内容,关键信息为Server is ready to receive web requests.
1 | ● prometheus.service - prometheus |
容器安装
容器安装的方式需先安装Docker环境,首先先配置docker-ce repository
1 | # 安装所需要的包,yum-utils提供了yum-config-manager工具,device-mapper-persistent-data和lvm2是设备映射存储驱动所需要的 |
说明
若无法访问国外网站,可配置国内阿里云的docker源
配置好Docker仓库后,执行如下命令安装最新版Docker
1 | # 安装最新版本的docker-ce |
说明
若要安装指定版本的docker,按照如下步骤
2
3
4
5
yum list docker-ce --showduplicates | sort -r
# 确认好要安装的版本,例如为18.09.9,则替换yum install docker-ce-<VERSION_STRING> docker-ce-cli-<VERSION_STRING> containerd.io -y中的<VERSION_STRING>进行安装
例如:yum install docker-ce-18.09.9 docker-ce-cli-18.09.9 containerd.io -y
启动Docker并设置开机自启
1 | systemctl start docker |
设置阿里云镜像加速器(可选)
1 | mkdir -p /etc/docker |
在https://prometheus.io/download/根据操作系统和架构类型找到最新版本的Prometheus Server安装包。
解压,将解压目录中的Prometheus配置文件prometheus.yml拷贝到/opt/prometheus目录中
1 | tar zxf prometheus-2.29.1.linux-amd64.tar.gz |
使用Prometheus的镜像启动Prometheus Server,将宿主机文件系统中的prometheus.yml文件挂载到容器中的/etc/prometheus/prometheus.yml,使用容器数据卷实现Prometheus数据持久化存储到宿主机上并设置容器名称为prometheus(便于后续对容器进行重启等操作)
1 | docker run -d --restart=always --name=prometheus -p 9090:9090 -v /opt/prometheus/data:/prometheus -v /opt/prometheus/prometheus.yml:/etc/prometheus/prometheus.yml prom/prometheus:v2.29.1 |
访问Portal
启动完成后,可以通过http://<IP>:9090访问Prometheus的UI界面
Prometheus配置
官网文档:https://prometheus.io/docs/prometheus/latest/configuration/configuration/
Prometheus通过命令行标志和配置文件进行配置。虽然命令行标志配置了不可变的系统参数(例如存储位置、要保存在磁盘和内存中的数据等),但配置文件定义了与抓取作业及其实例相关的所有内容,以及要加载的规则文件。要查看所有可用的命令行标志,可运行./prometheus -h
Prometheus可以在运行时重新加载其配置。如果新配置的格式不正确,则不会应用更改。通过向Prometheus进程发送SIGHUP信号或向通过curl -X POST http://[IP]:[Port]/-/reload向/-/reload发送HTTP POST请求,可以触发配置重新加载,这也将重新加载任何已配置的规则文件。
说明
热加载功能从2.0版本开始默认关闭,要在启动Prometheus时添加--web.enable-lifecycle标志
配置文件
要指定要加载的配置文件,可使用--config.file标志
该文件以YAML格式编写,由下面描述的方案定义。括号表示参数是可选的。对于非列表参数,该值设置为指定的默认值。
通用占位符定义如下:
<boolean>: 一个布尔值,可以取值true或false<duration>: 匹配正则表达式的持续时间((([0-9]+)y)?(([0-9]+)w)?(([0-9]+)d)?(([0-9]+)h)?(([0-9]+)m)?(([0-9]+)s)?(([0-9]+)ms)?|0),例如1d,1h30m,5m,10s<filename>: 当前工作目录中的有效路径<host>: 由主机名或IP后跟可选端口号组成的有效字符串<int>: 一个整数值<labelname>: 匹配正则表达式的字符串[a-zA-Z_][a-zA-Z0-9_]*<labelvalue>: 一串unicode字符<path>: 一个有效的URL路径<scheme>: 一个可以取值的字符串http或https<secret>:作为秘密的常规字符串,例如密码<string>: 普通字符串<size>:以字节为单位的大小,例如512MB。需要一个单位。支持的单位:B、KB、MB、GB、TB、PB、EB。<tmpl_string>: 使用前模板扩展的字符串
其他占位符是单独指定的。
全局配置指定在所有其他配置上下文中有效的参数。它们还用作其他配置部分的默认值。
1 | global: |
scrape_config部分指定一组目标和参数,描述如何对其进行抓取。在一般情况下,一个抓取配置指定单个作业。在高级配置中,这可能会改变。可以通过static_configs参数静态配置目标,也可以使用支持的服务发现机制之一动态发现目标。此外,relabel_configs配置允许在抓取之前对任何目标及其标签进行高级修改。
1 | # The job name assigned to scraped metrics by default. |
更多配置参数可查看https://github.com/prometheus/prometheus/blob/main/config/testdata/conf.good.yml
监控指标数据模型
数据模型
- Prometheus将所有数据存储为时间序列;
- 具有相同度量名称以及标签属于同一个指标;
- 每个时间序列都由度量标准名称和一组键值对(称为标签)唯一标识,通过标签查询指定指标。
指标格式
<metric name>{<label name>=<label value>,...}
使用Node Export采集主机数据
安装Node Export采集主机数据
在Prometheus的架构设计中,Prometheus Server并不直接服务监控特定的目标,其主要任务负责数据的收集,存储并且对外提供数据查询支持。因此为了能够能够监控到某些东西,如主机的CPU使用率,我们需要使用到Exporter。Prometheus周期性的从Exporter暴露的HTTP服务地址(通常是/metrics)拉取监控样本数据。
从上面的描述中可以看出Exporter可以是一个相对开放的概念,其可以是一个独立运行的程序独立于监控目标以外,也可以是直接内置在监控目标中。只要能够向Prometheus提供标准格式的监控样本数据即可。
为了能够采集到主机的运行指标如CPU, 内存,磁盘等信息。可以使用Node Exporter。Node Exporter同样采用Golang编写,并且不存在任何的第三方依赖,只需要下载,解压即可运行。可以在https://prometheus.io/download/根据操作系统和架构类型获取最新的node exporter版本的二进制包。
运行node exporter
1 | tar zxf node_exporter-1.2.2.linux-amd64.tar.gz |
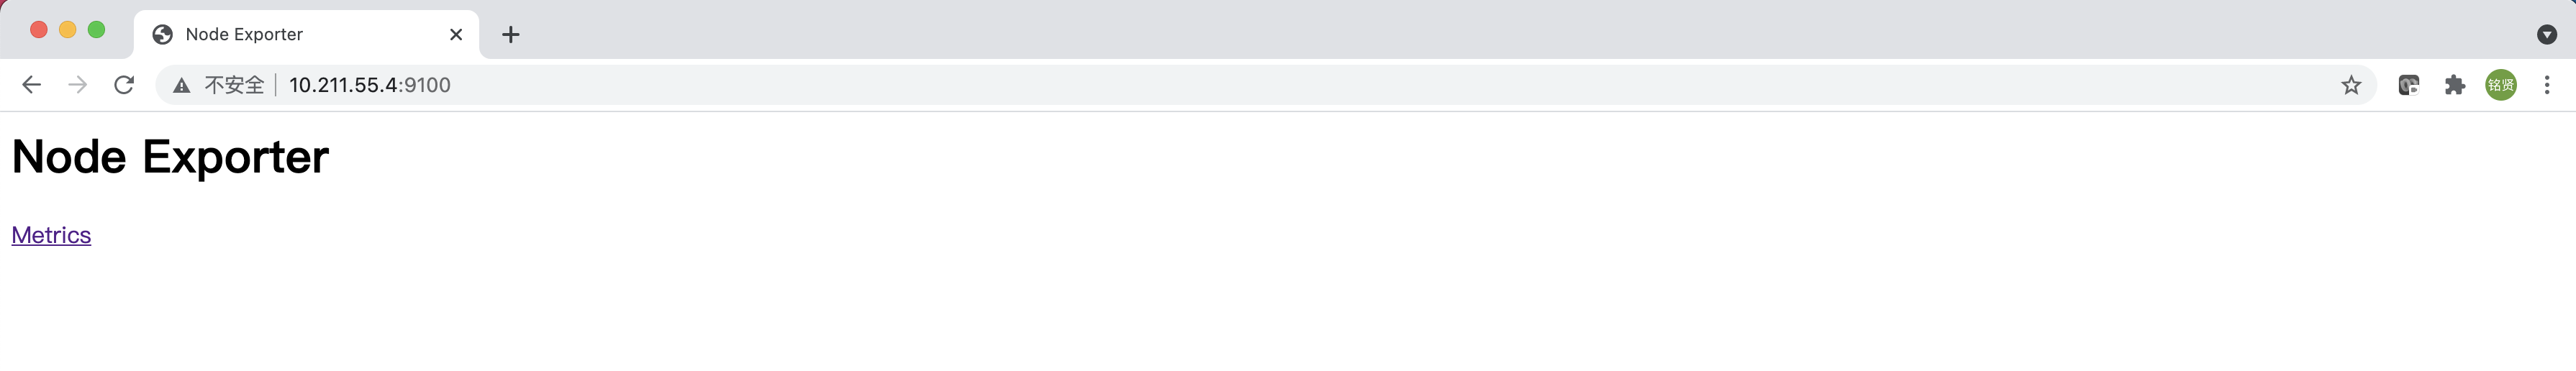
访问http://<IP>:9100可以看到以下页面
初识Node Exporter监控指标
访问http://<IP>:9100/metrics,可以看到当前node export获取到的当前主机的所有监控数据,如下所示。
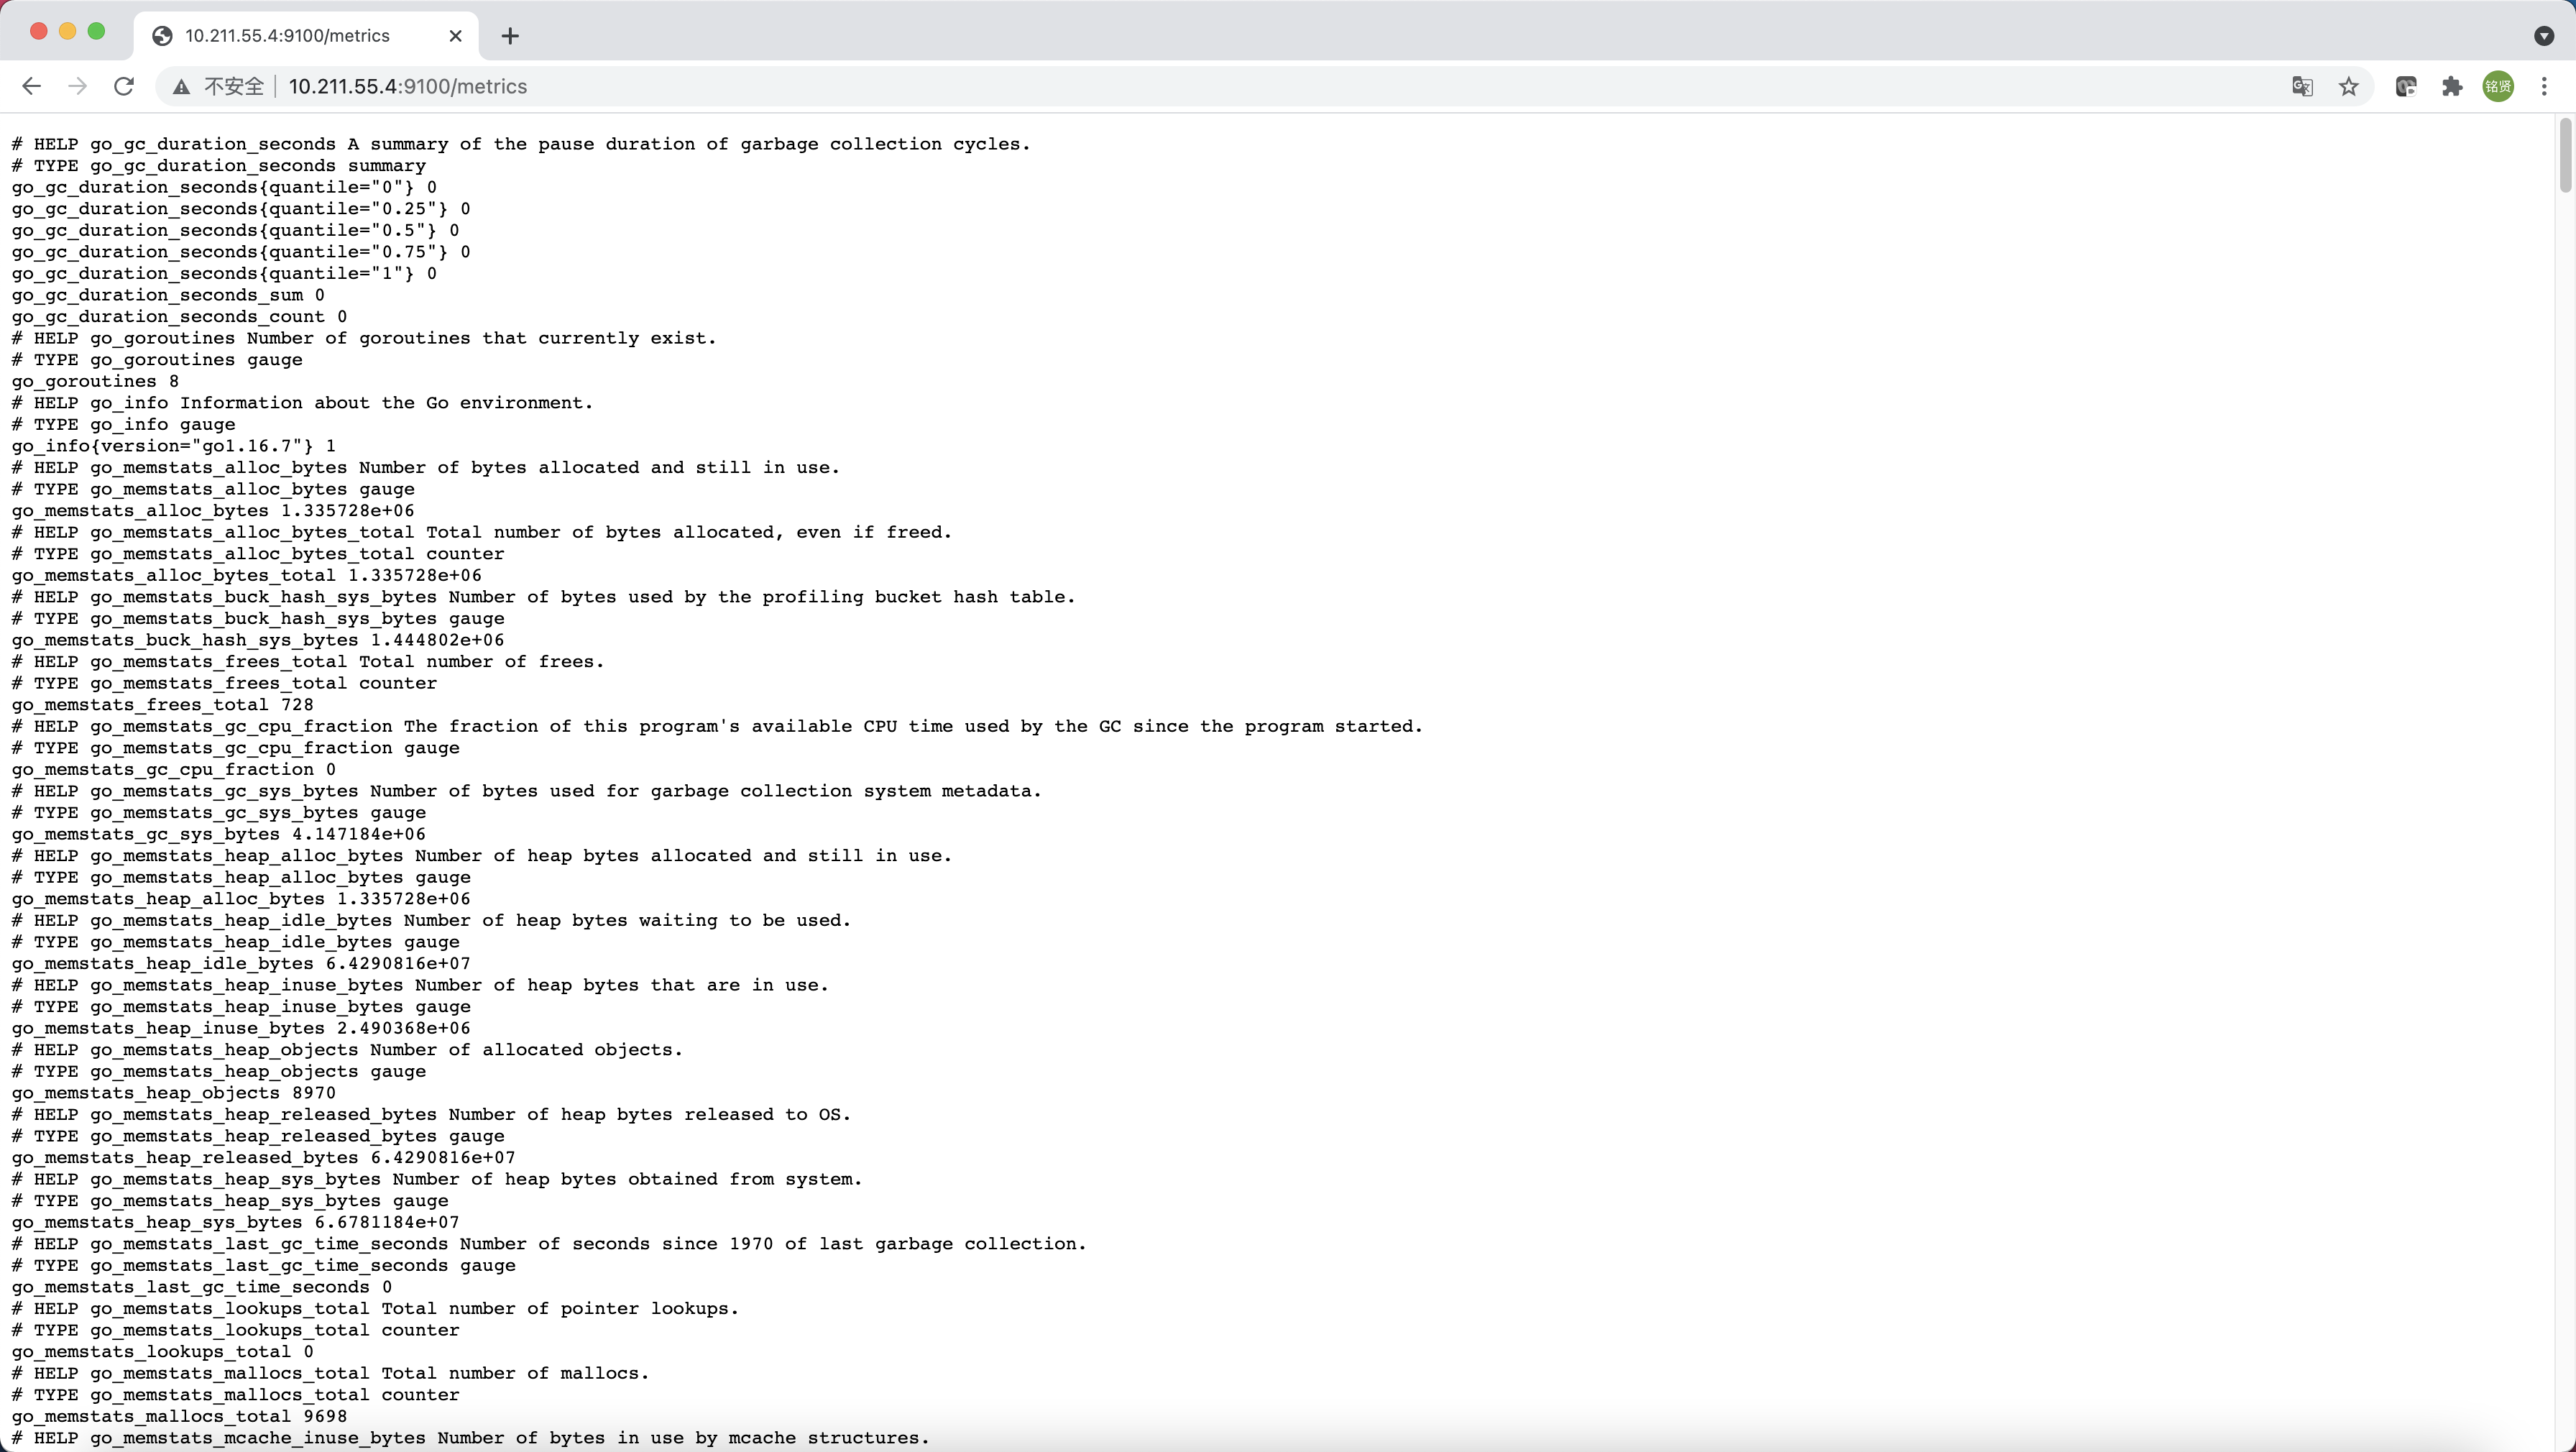
每一个监控指标之前都会有一段类似于如下形式的信息:
1 | # HELP node_cpu_seconds_total Seconds the CPUs spent in each mode. |
其中HELP用于解释当前指标的含义,TYPE则说明当前指标的数据类型。在上面的例子中node_cpu_seconds_total的注释表明当前指标是cpu0上idle进程占用CPU的总时间,CPU占用时间是一个只增不减的度量指标,从类型中也可以看出node_cpu_seconds_total的数据类型是计数器(counter),与该指标的实际含义一致。又例如node_load1该指标反映了当前主机在最近一分钟以内的负载情况,系统的负载情况会随系统资源的使用而变化,因此node_load1反映的是当前状态,数据可能增加也可能减少,从注释中可以看出当前指标类型为仪表盘(gauge),与指标反映的实际含义一致。
除了这些以外,在当前页面中根据主机系统的不同,你还可能看到如下监控指标:
node_boot_time:系统启动时间node_cpu:系统CPU使用量node_disk_io*:磁盘IOnode_filesystem*:文件系统用量node_load*:系统负载node_memory*:内存使用量node_network*:网络带宽node_time*:当前系统时间go_*:node exporter中go相关指标process_*:node exporter自身进程相关运行指标
从Node Exporter收集监控数据
为了让Prometheus Server能够从当前node exporter获取到监控数据,这里需要修改Prometheus配置文件。编辑prometheus.yml并在scrape_configs节点下添加以下内容:
1 | scrape_configs: |
重启Prometheus Server或者重新热加载配置文件
1 | # 二进制包安装 |
访问http://<IP>:9090,进入到Prometheus Server。输入“up”并且单击Execute按钮,如果Prometheus能够正常从node exporter获取数据,则会看到以下执行结果,其中“1”表示正常,反之“0”则为异常。
1 | up{instance="10.211.55.4:9100", job="node"} 1 |
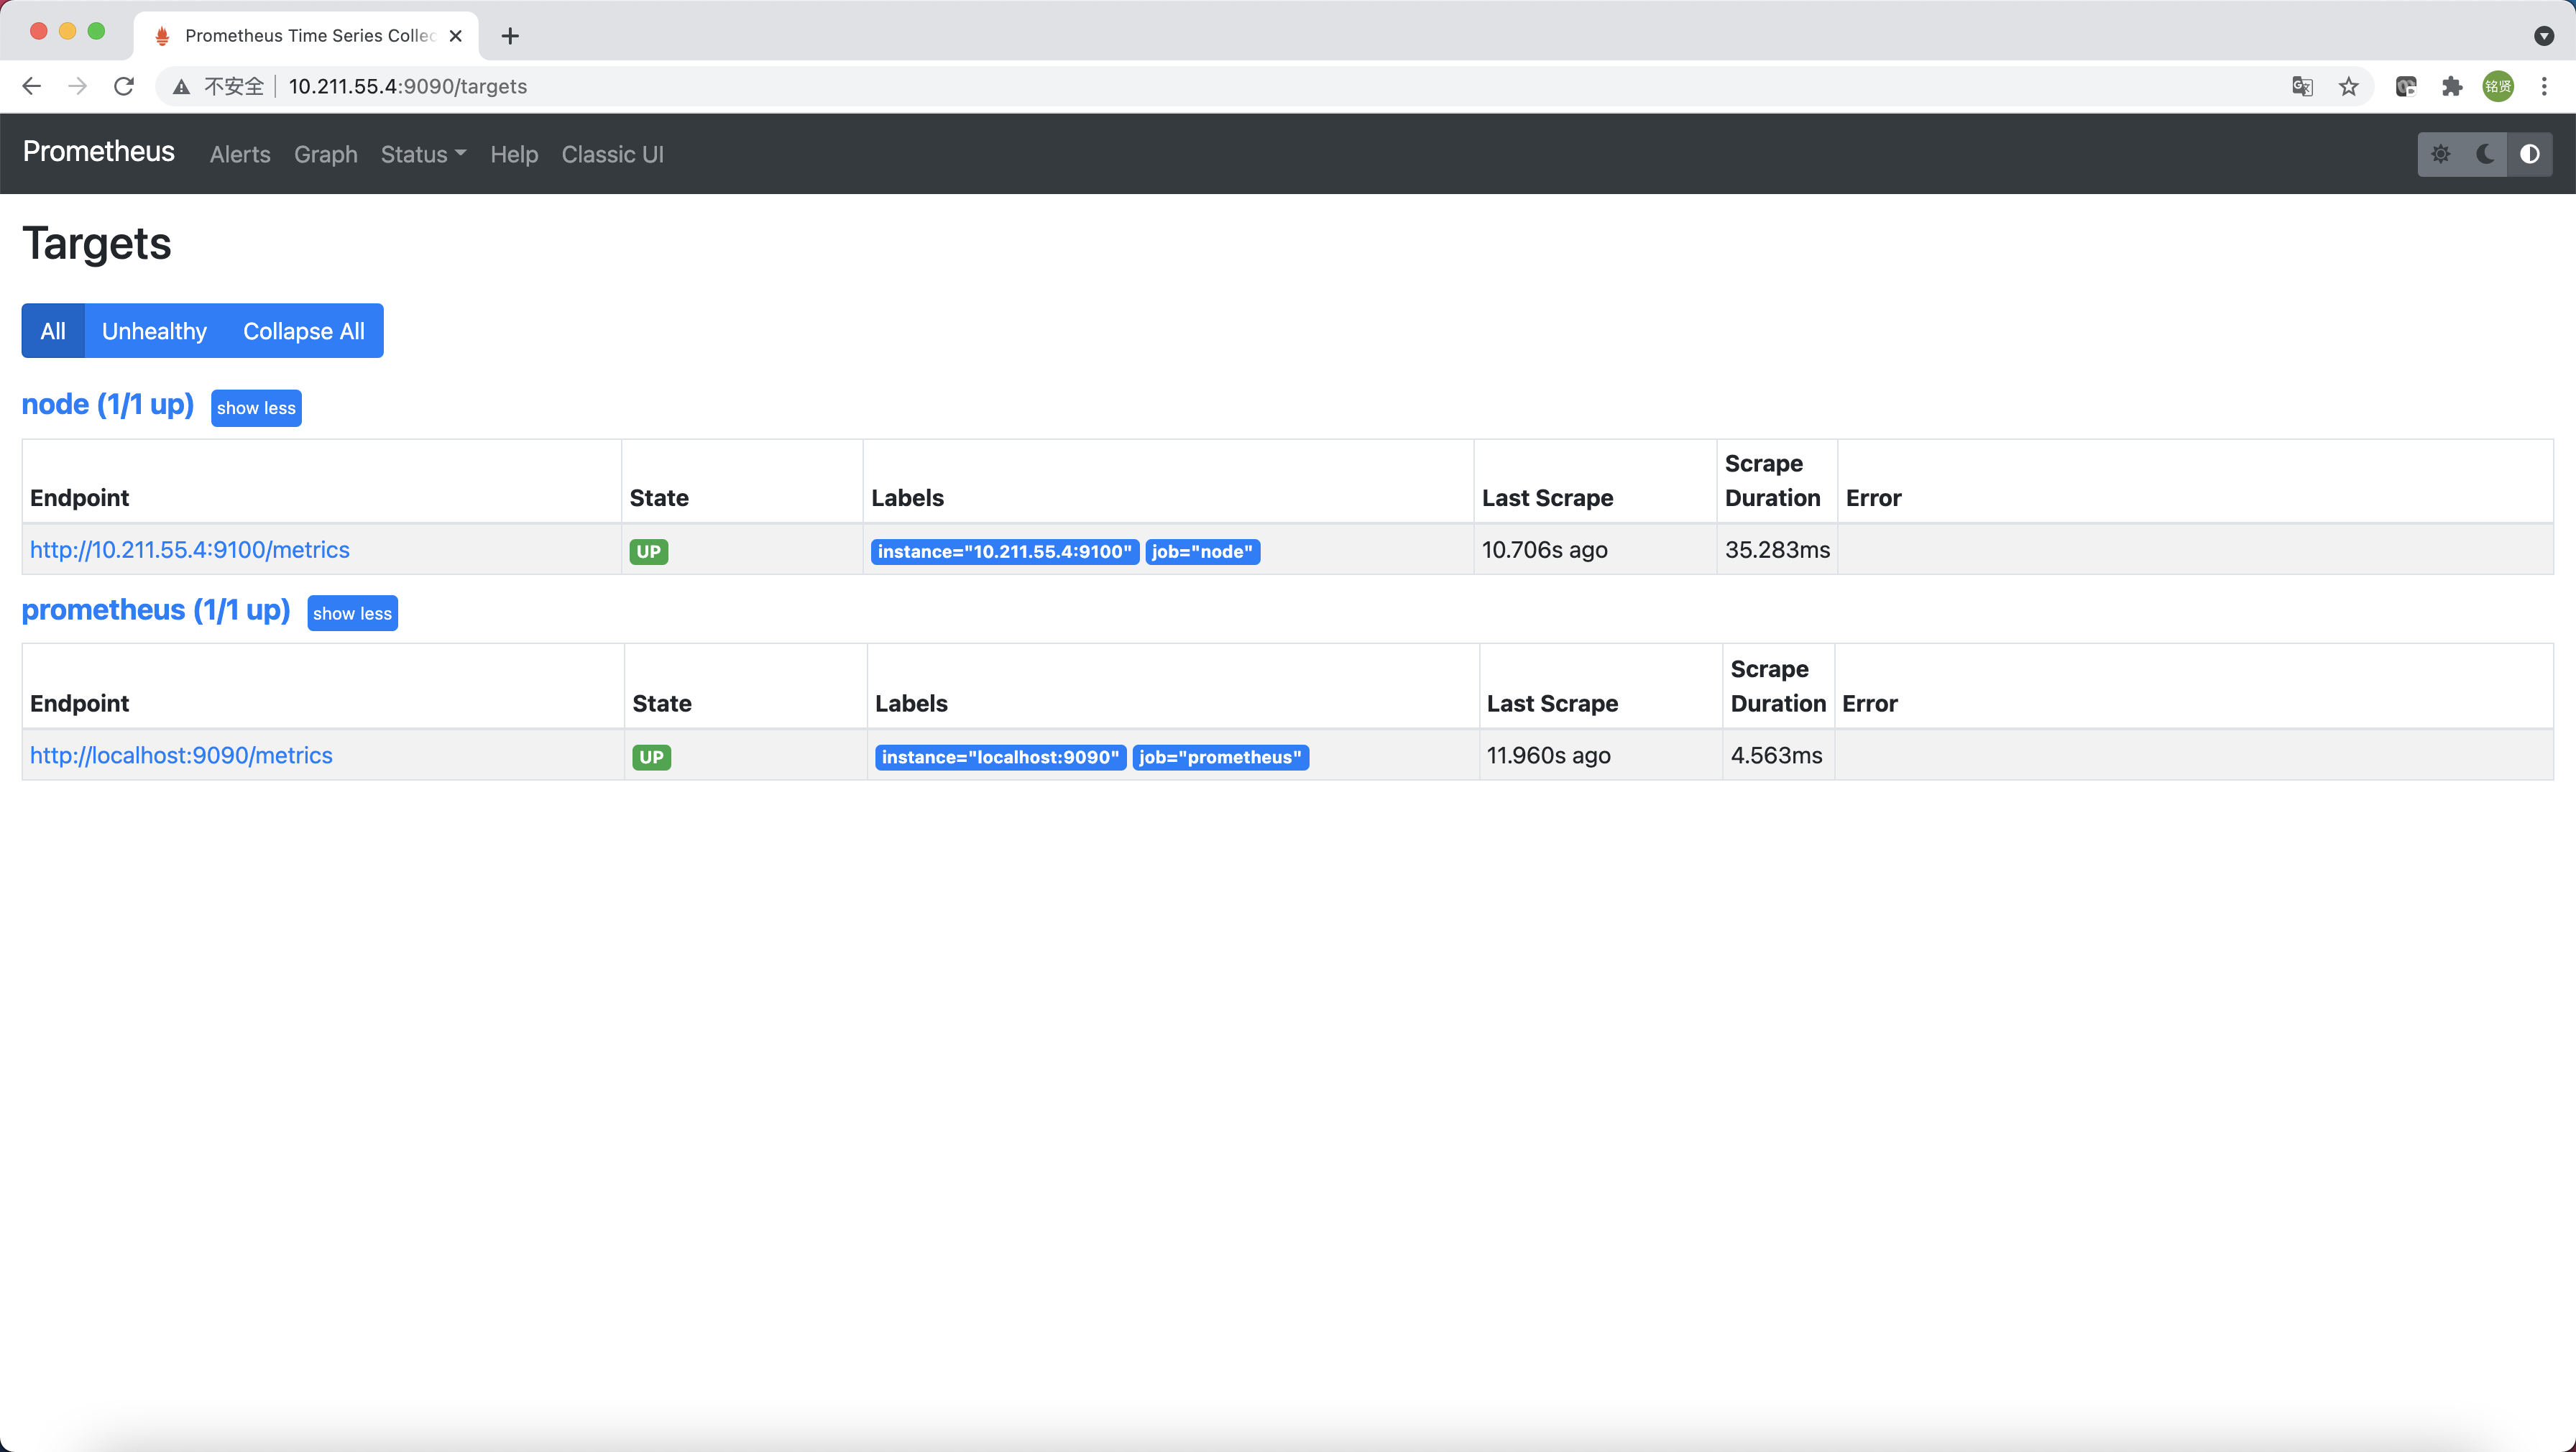
或者直接选择"Status"->"Targets",如果Prometheus能够正常从node exporter获取数据,可以看到targets的State为UP
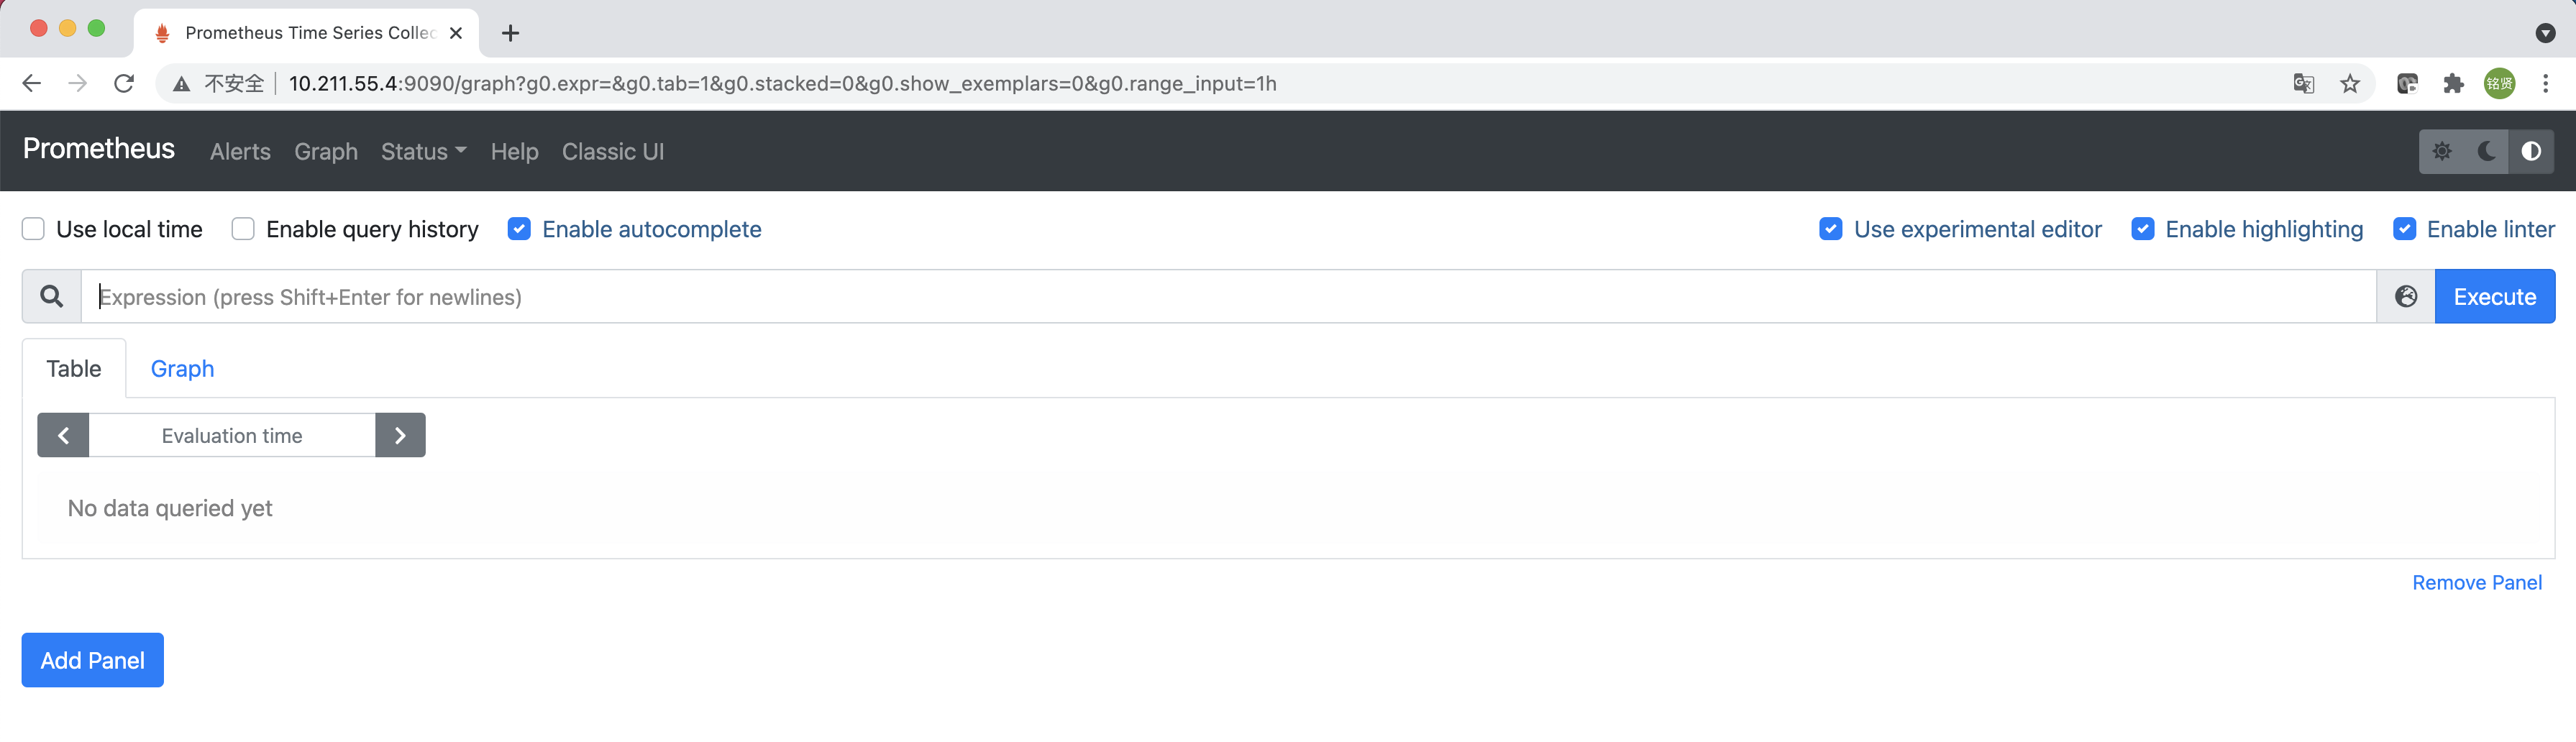
使用PromQL查询监控数据
Prometheus UI是Prometheus内置的一个可视化管理界面,通过Prometheus UI用户能够轻松的了解Prometheus当前的配置,监控任务运行状态等。 通过Graph面板,用户还能直接使用PromQL实时查询监控数据
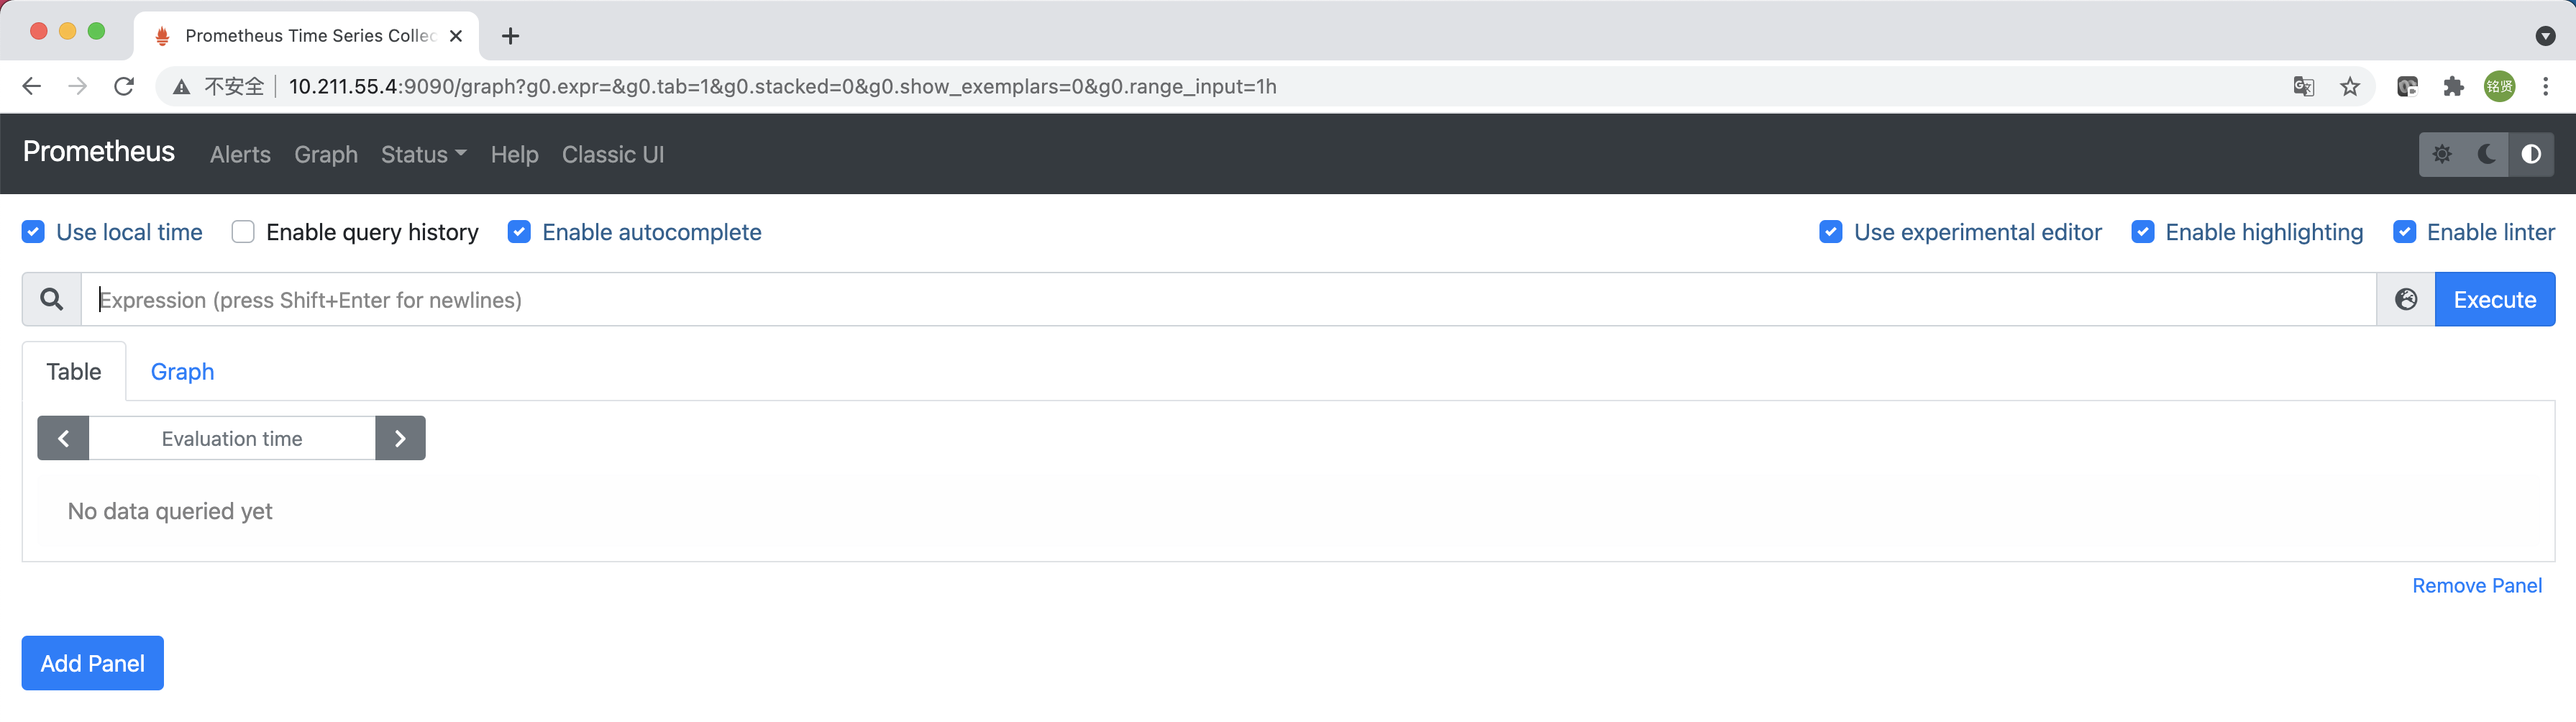
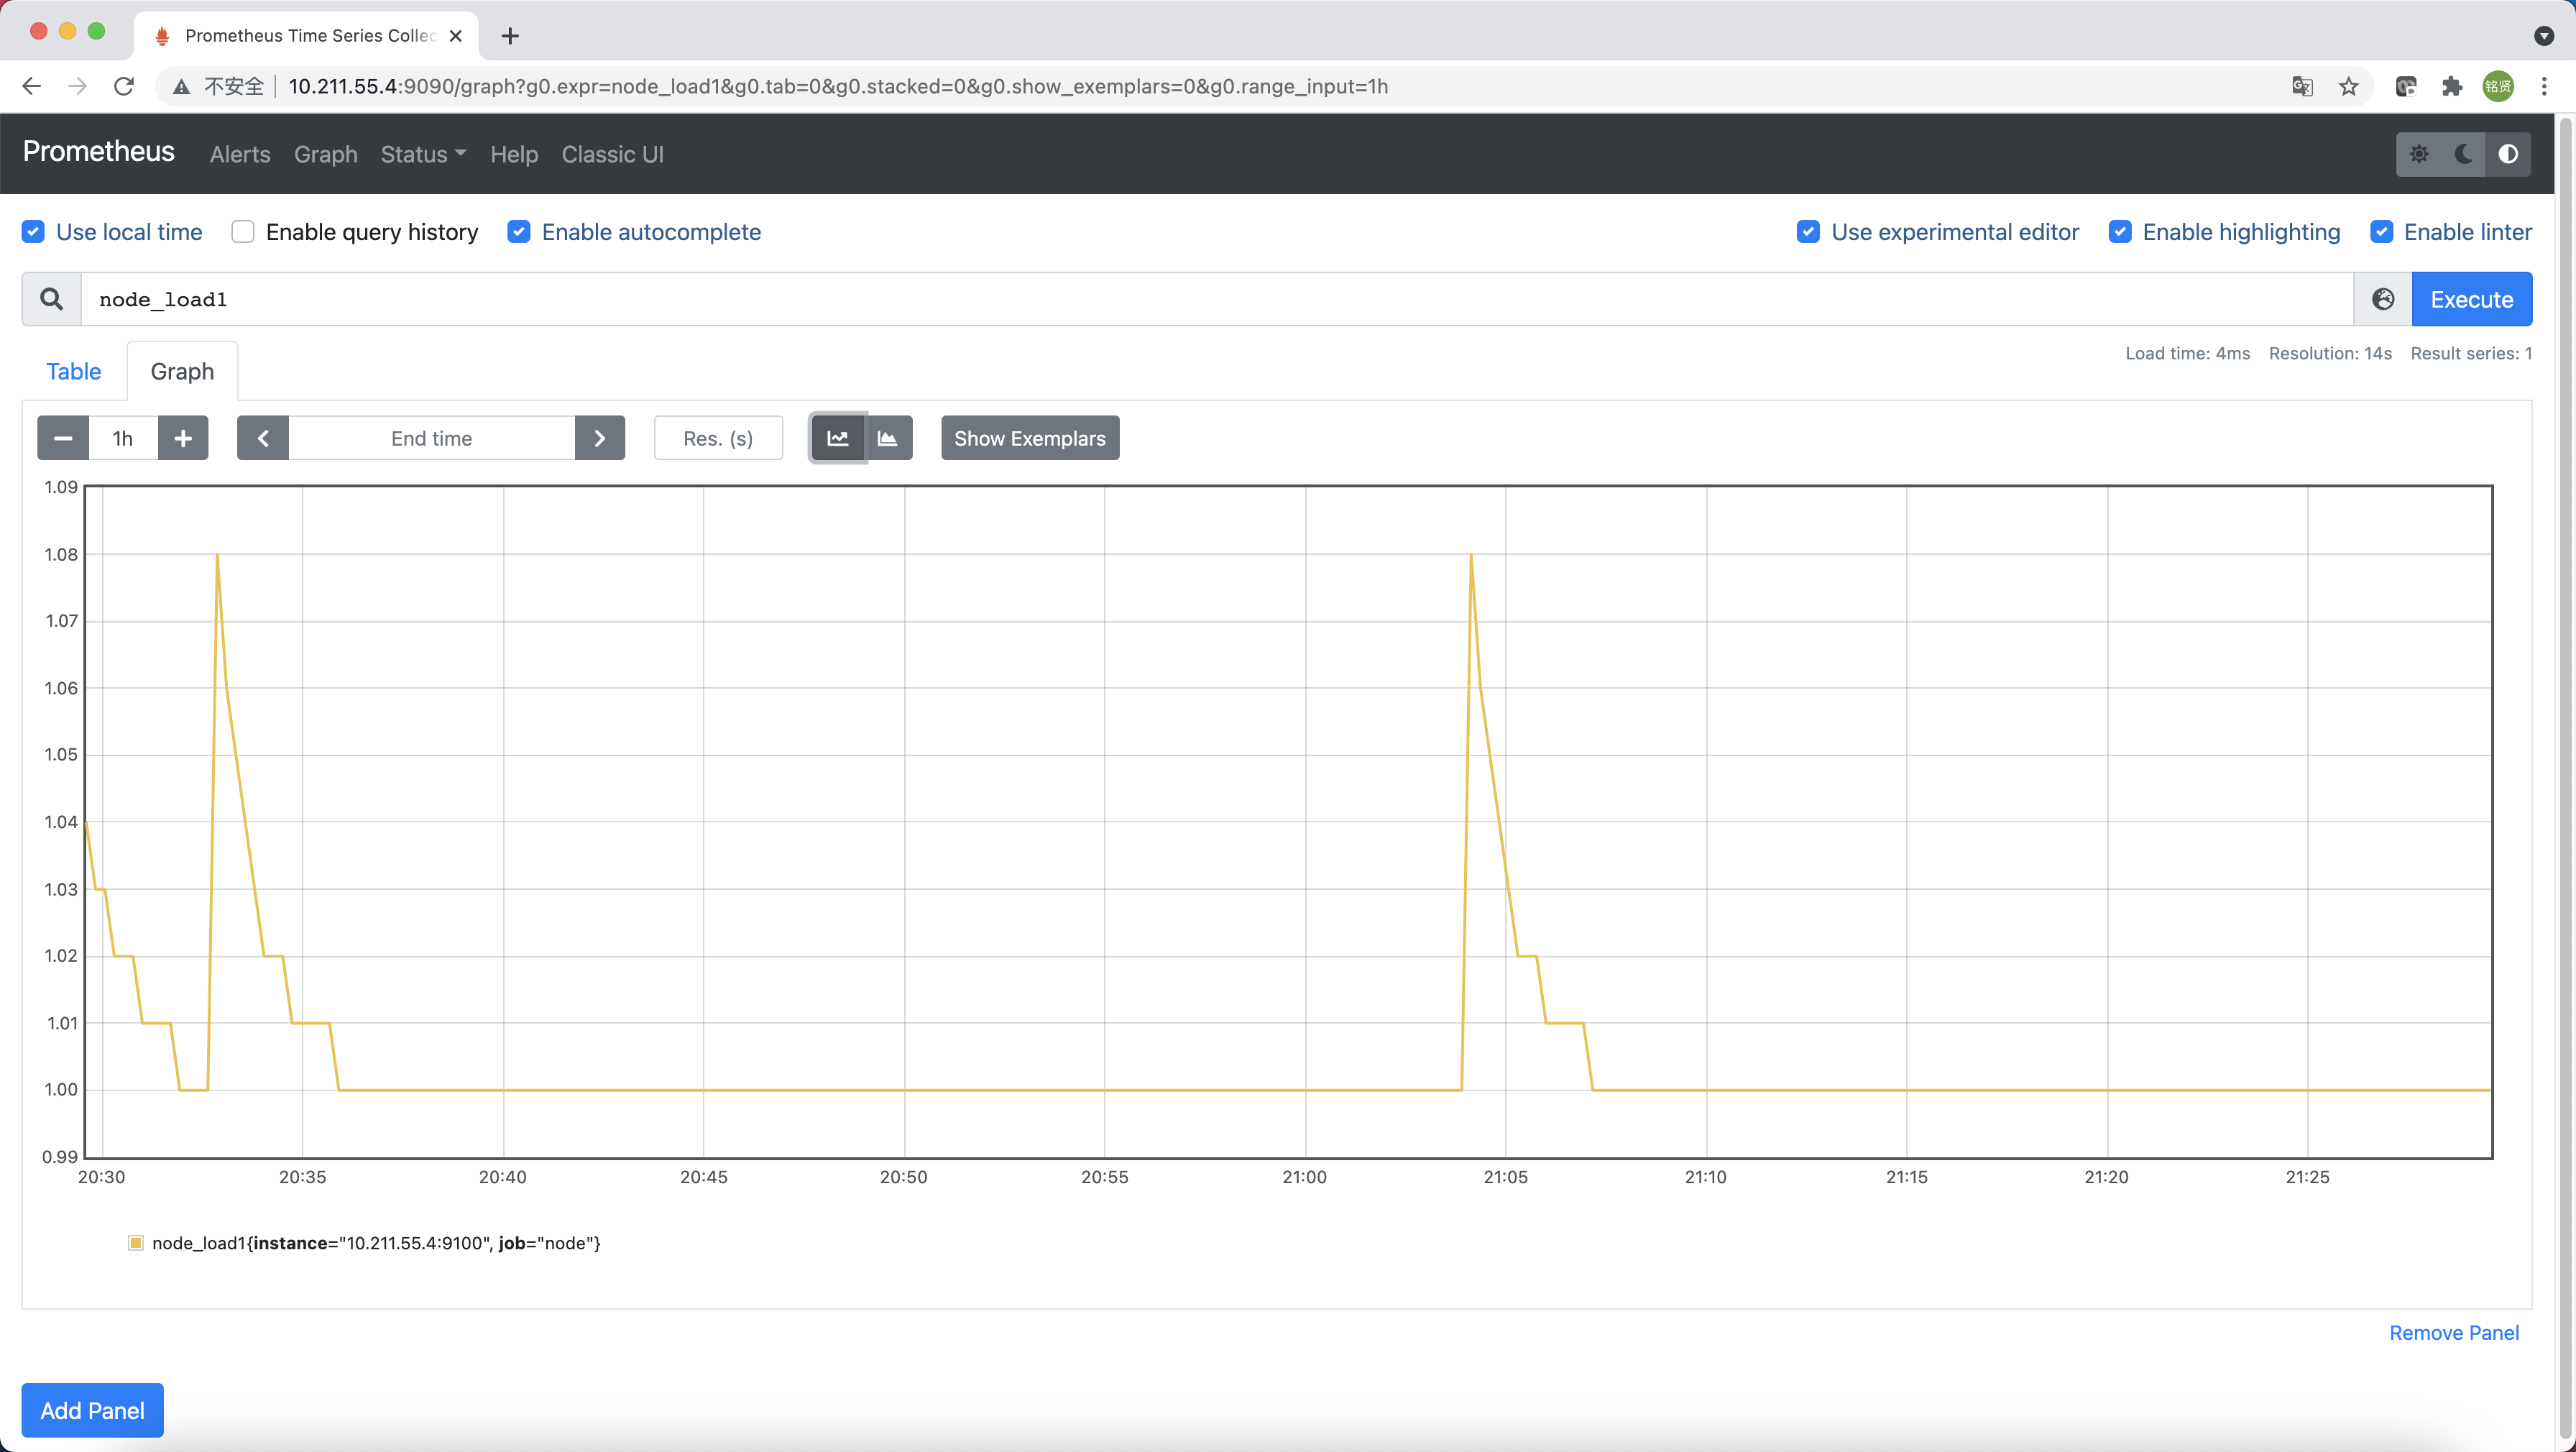
切换到Graph面板,用户可以使用PromQL表达式查询特定监控指标的监控数据。如下所示,查询主机负载变化情况,可以使用关键字node_load1可以查询出Prometheus采集到的主机负载的样本数据,这些样本数据按照时间先后顺序展示,形成了主机负载随时间变化的趋势图表
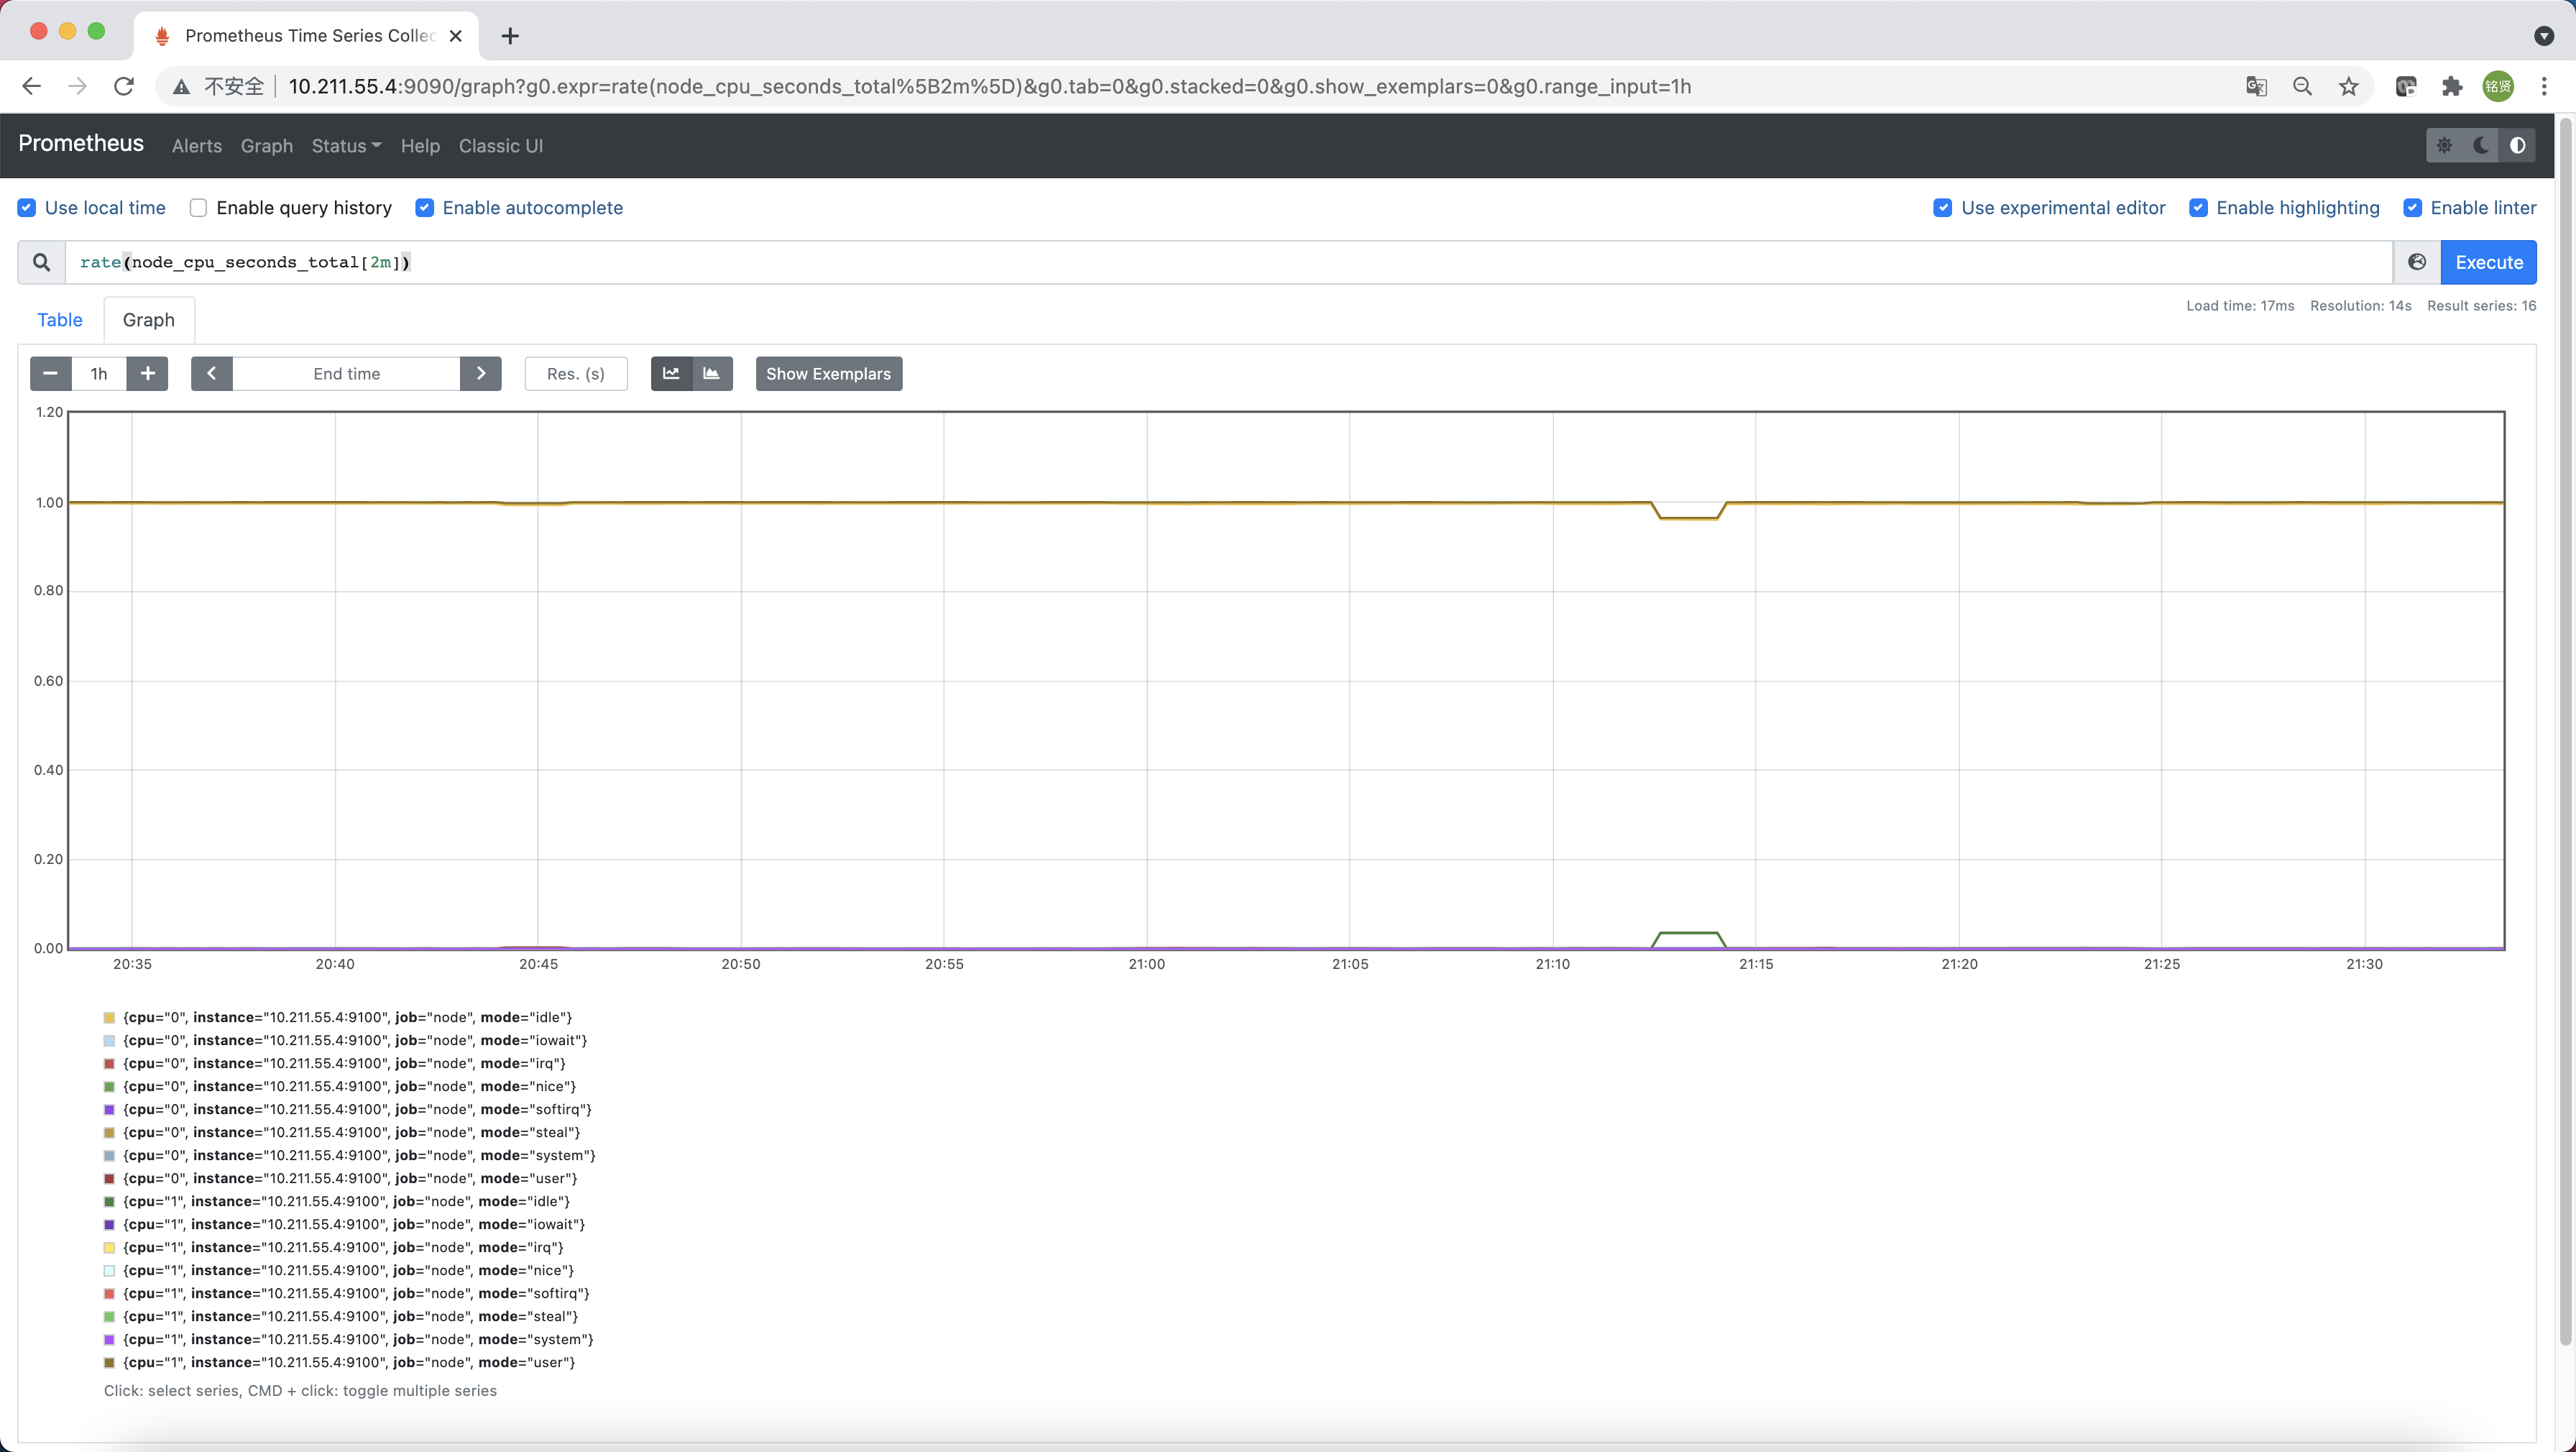
PromQL是Prometheus自定义的一套强大的数据查询语言,除了使用监控指标作为查询关键字以为,还内置了大量的函数,帮助用户进一步对时序数据进行处理。例如使用rate()函数,可以计算在单位时间内样本数据的变化情况即增长率,因此通过该函数我们可以近似的通过CPU使用时间计算CPU的利用率
1 | rate(node_cpu_seconds_total[2m]) |
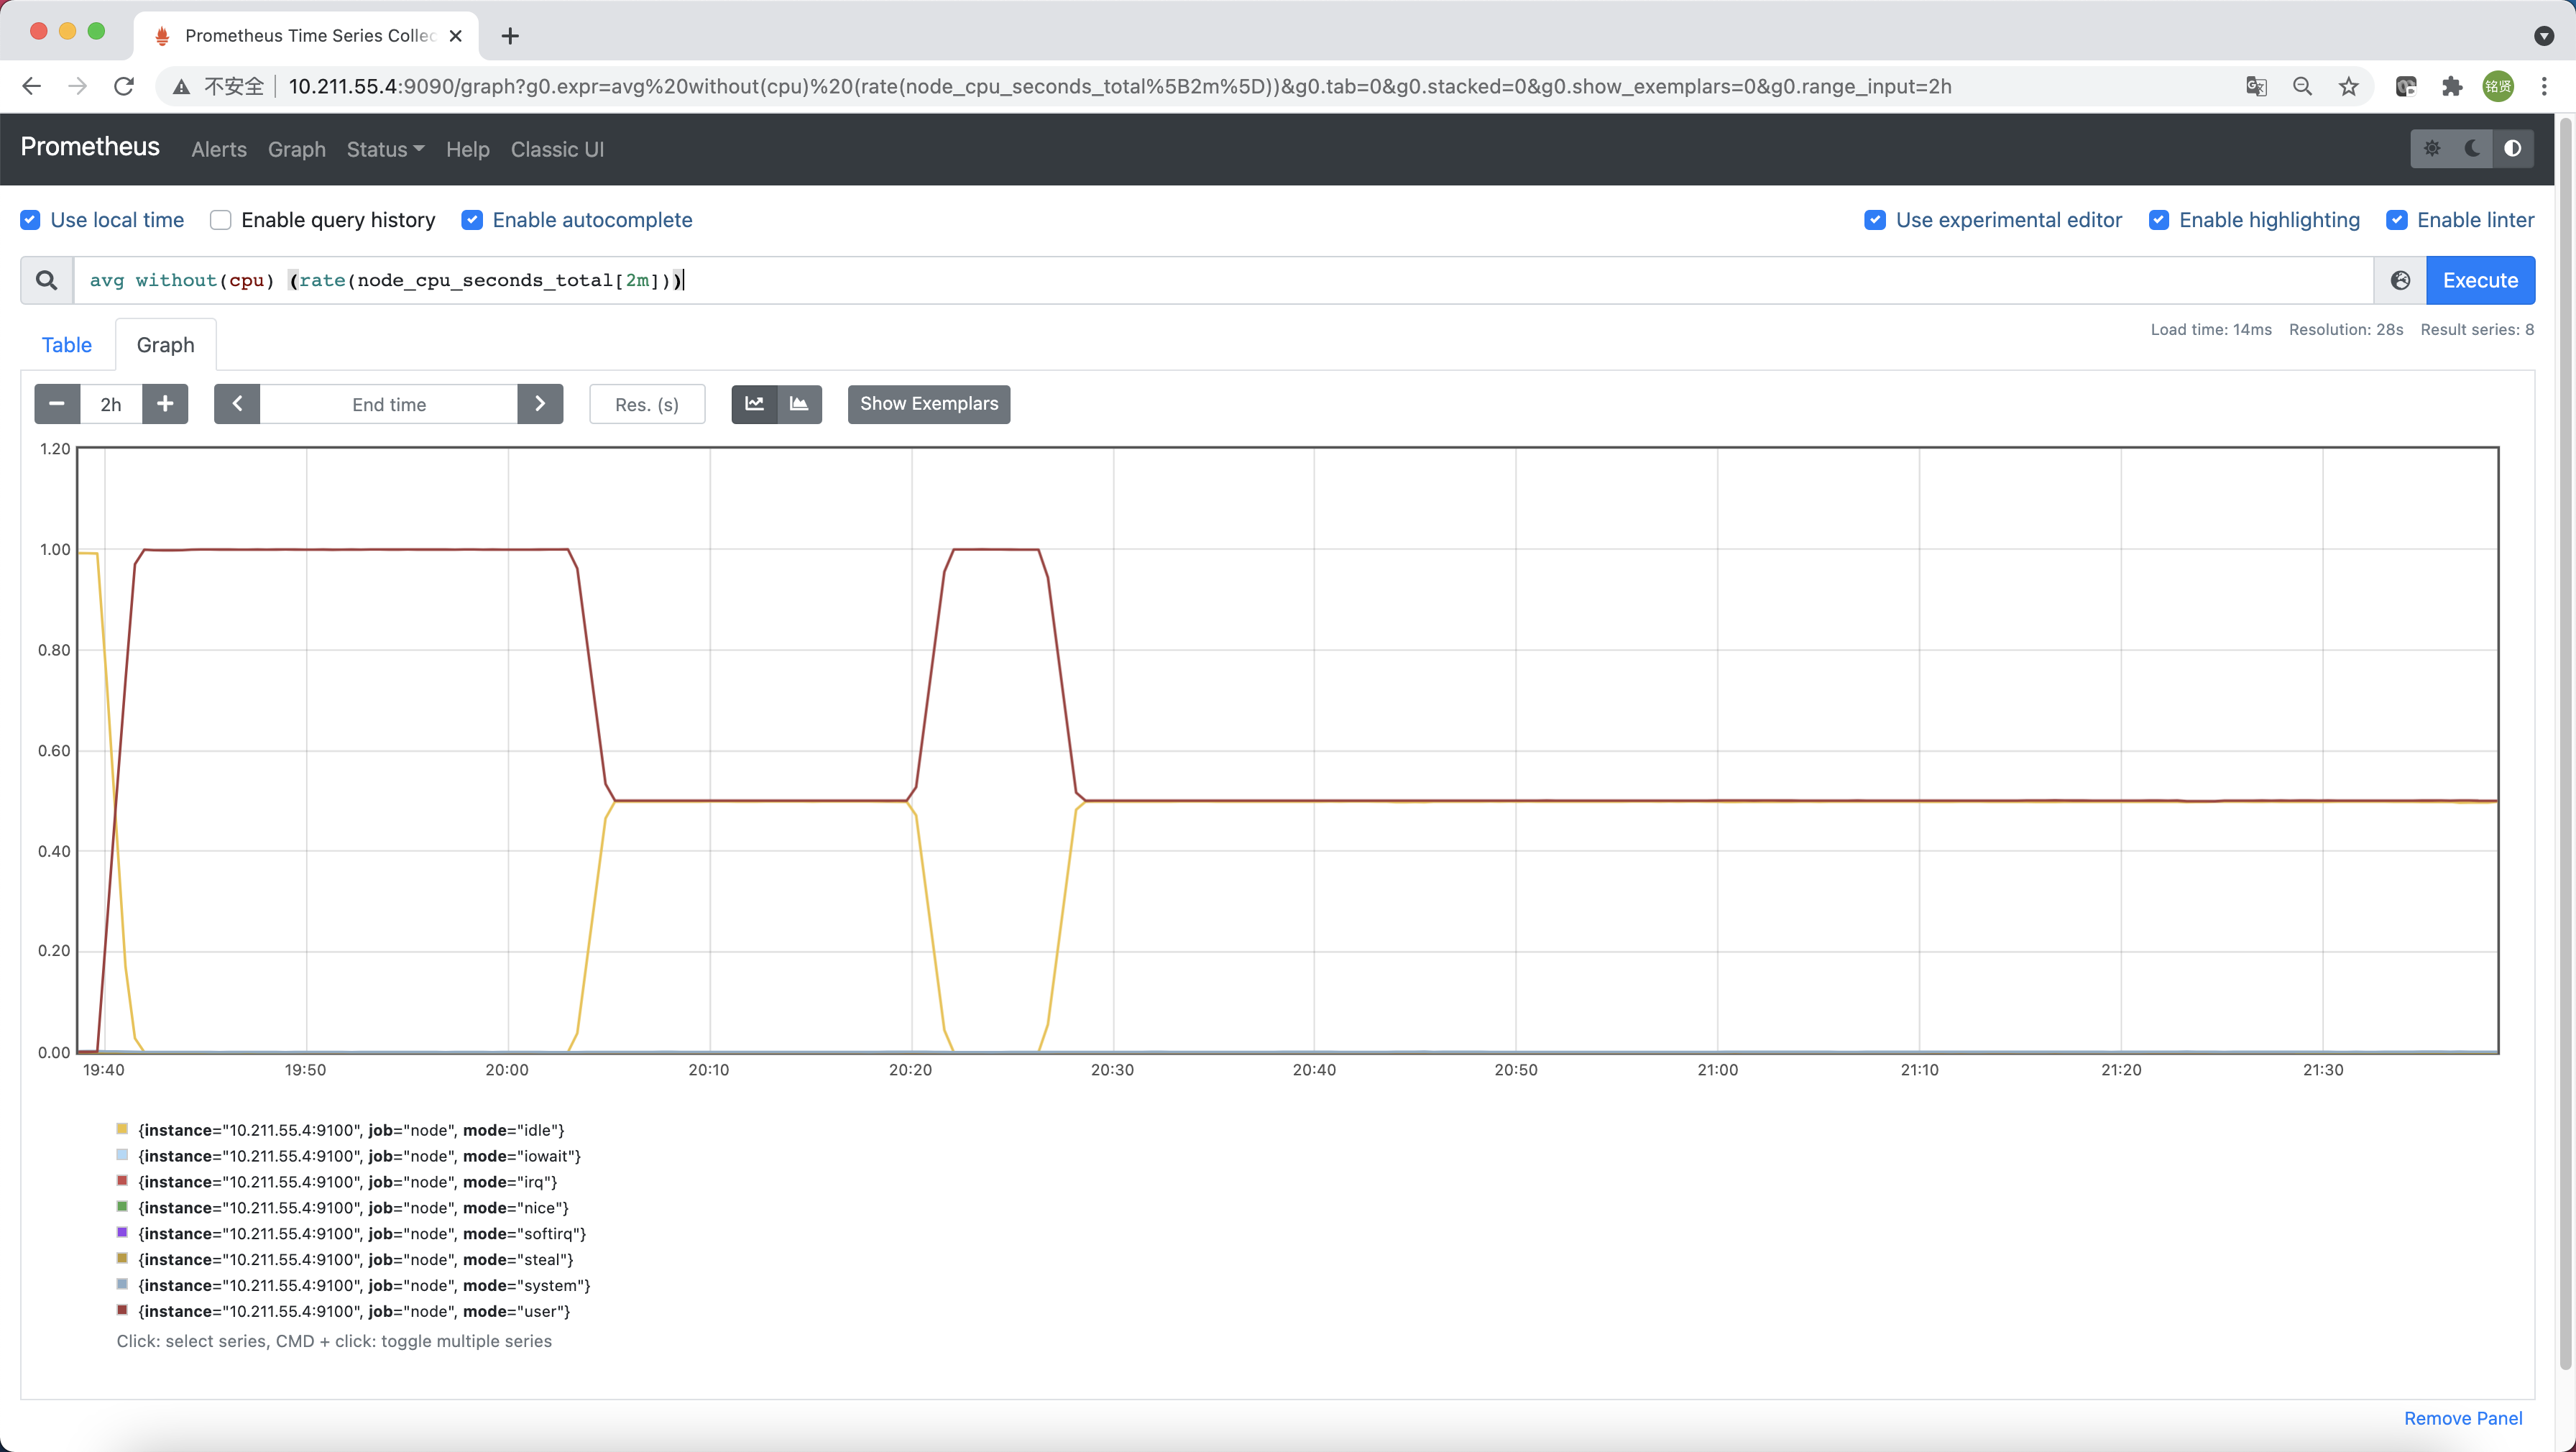
这时如果要忽略是哪一个CPU的,只需要使用without表达式,将标签CPU去除后聚合数据即可
1 | avg without(cpu) (rate(node_cpu_seconds_total[2m])) |
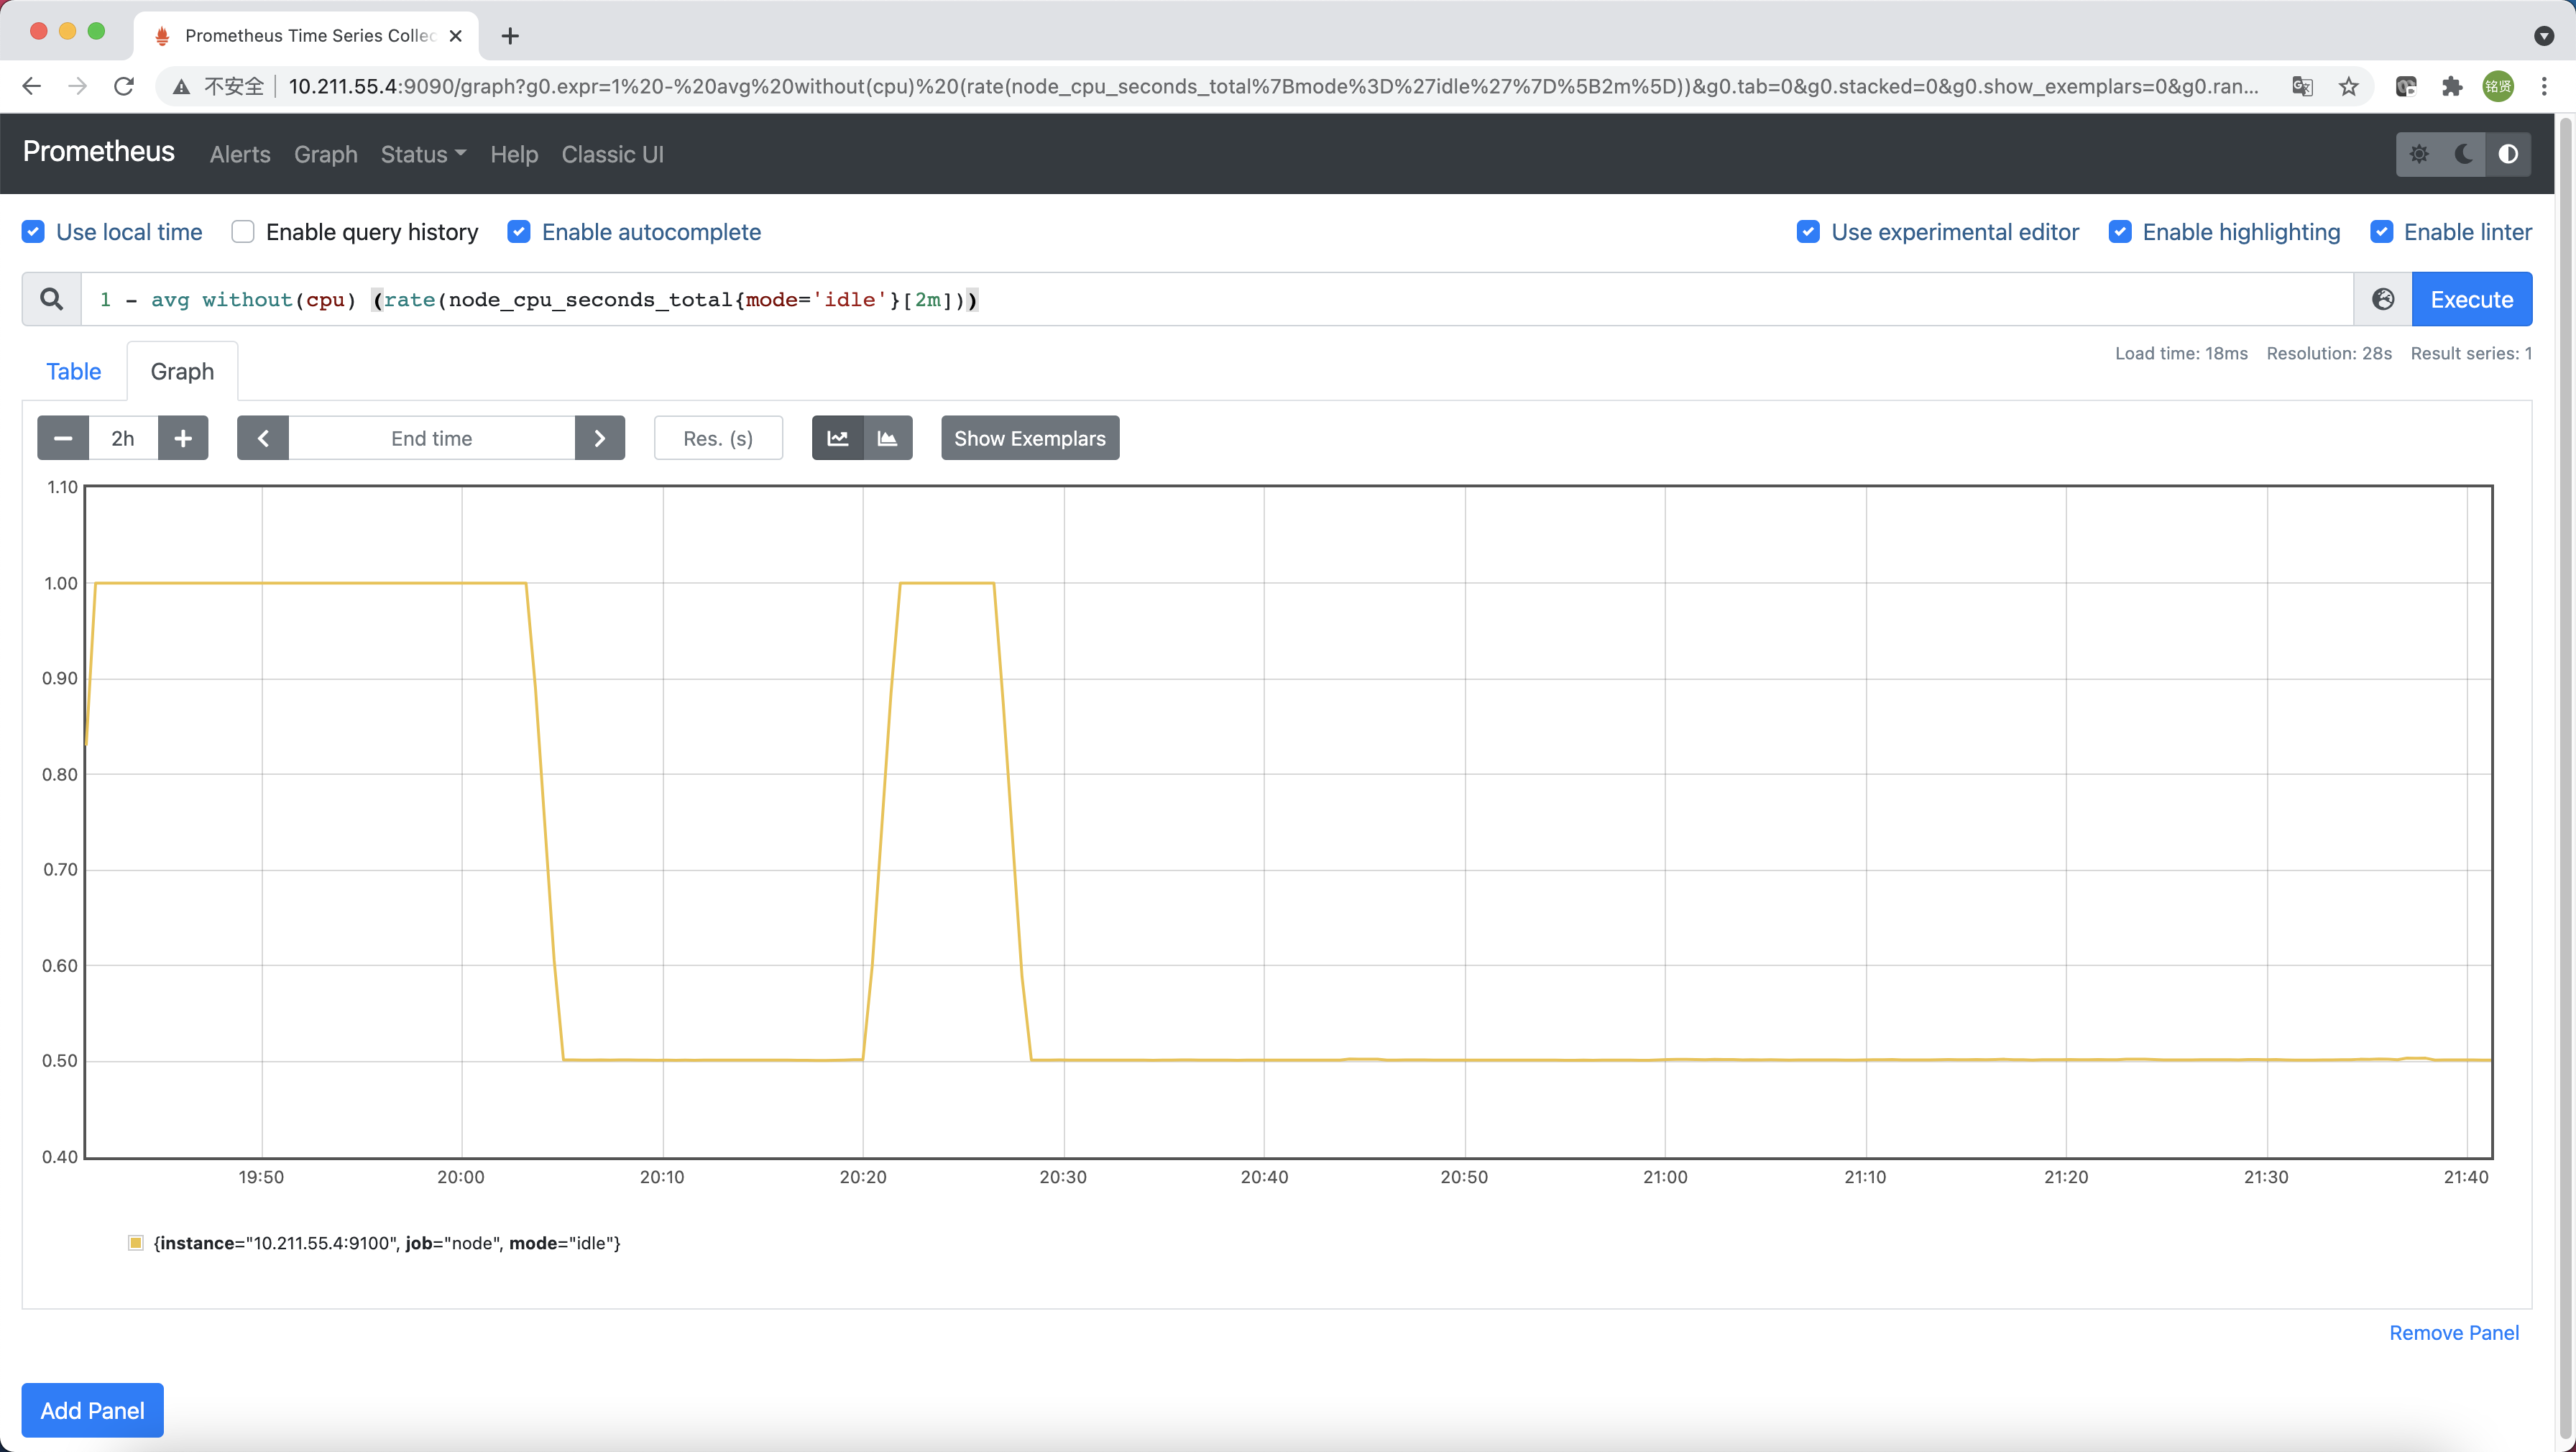
那如果需要计算系统CPU的总体使用率,通过排除系统闲置的CPU使用率即可获得
1 | 1 - avg without(cpu) (rate(node_cpu_seconds_total{mode='idle'}[2m])) |
通过PromQL我们可以非常方便的对数据进行查询,过滤,以及聚合,计算等操作。通过这些丰富的表达书语句,监控指标不再是一个单独存在的个体,而是一个个能够表达出正式业务含义的语言。
监控数据可视化
Prometheus UI提供了快速验证PromQL以及临时可视化支持的能力,而在大多数场景下引入监控系统通常还需要构建可以长期使用的监控数据可视化面板(Dashboard)。这时可以考虑使用第三方的可视化工具如Grafana,Grafana是一个开源的可视化平台,并且提供了对Prometheus的完整支持。
官网安装文档:https://grafana.com/docs/grafana/latest/setup-grafana/installation/
RPM包安装
配置Grafana OSS releases Yum源
1 | cat > /etc/yum.repos.d/grafana.repo << EOF |
安装Grafana
1 | yum install grafana -y |
启动Grafana
1 | systemctl daemon-reload |
容器安装
直接使用Grafana镜像启动即可
1 | docker run -d --restart=always -p 3000:3000 --name grafana grafana/grafana:8.1.1 |
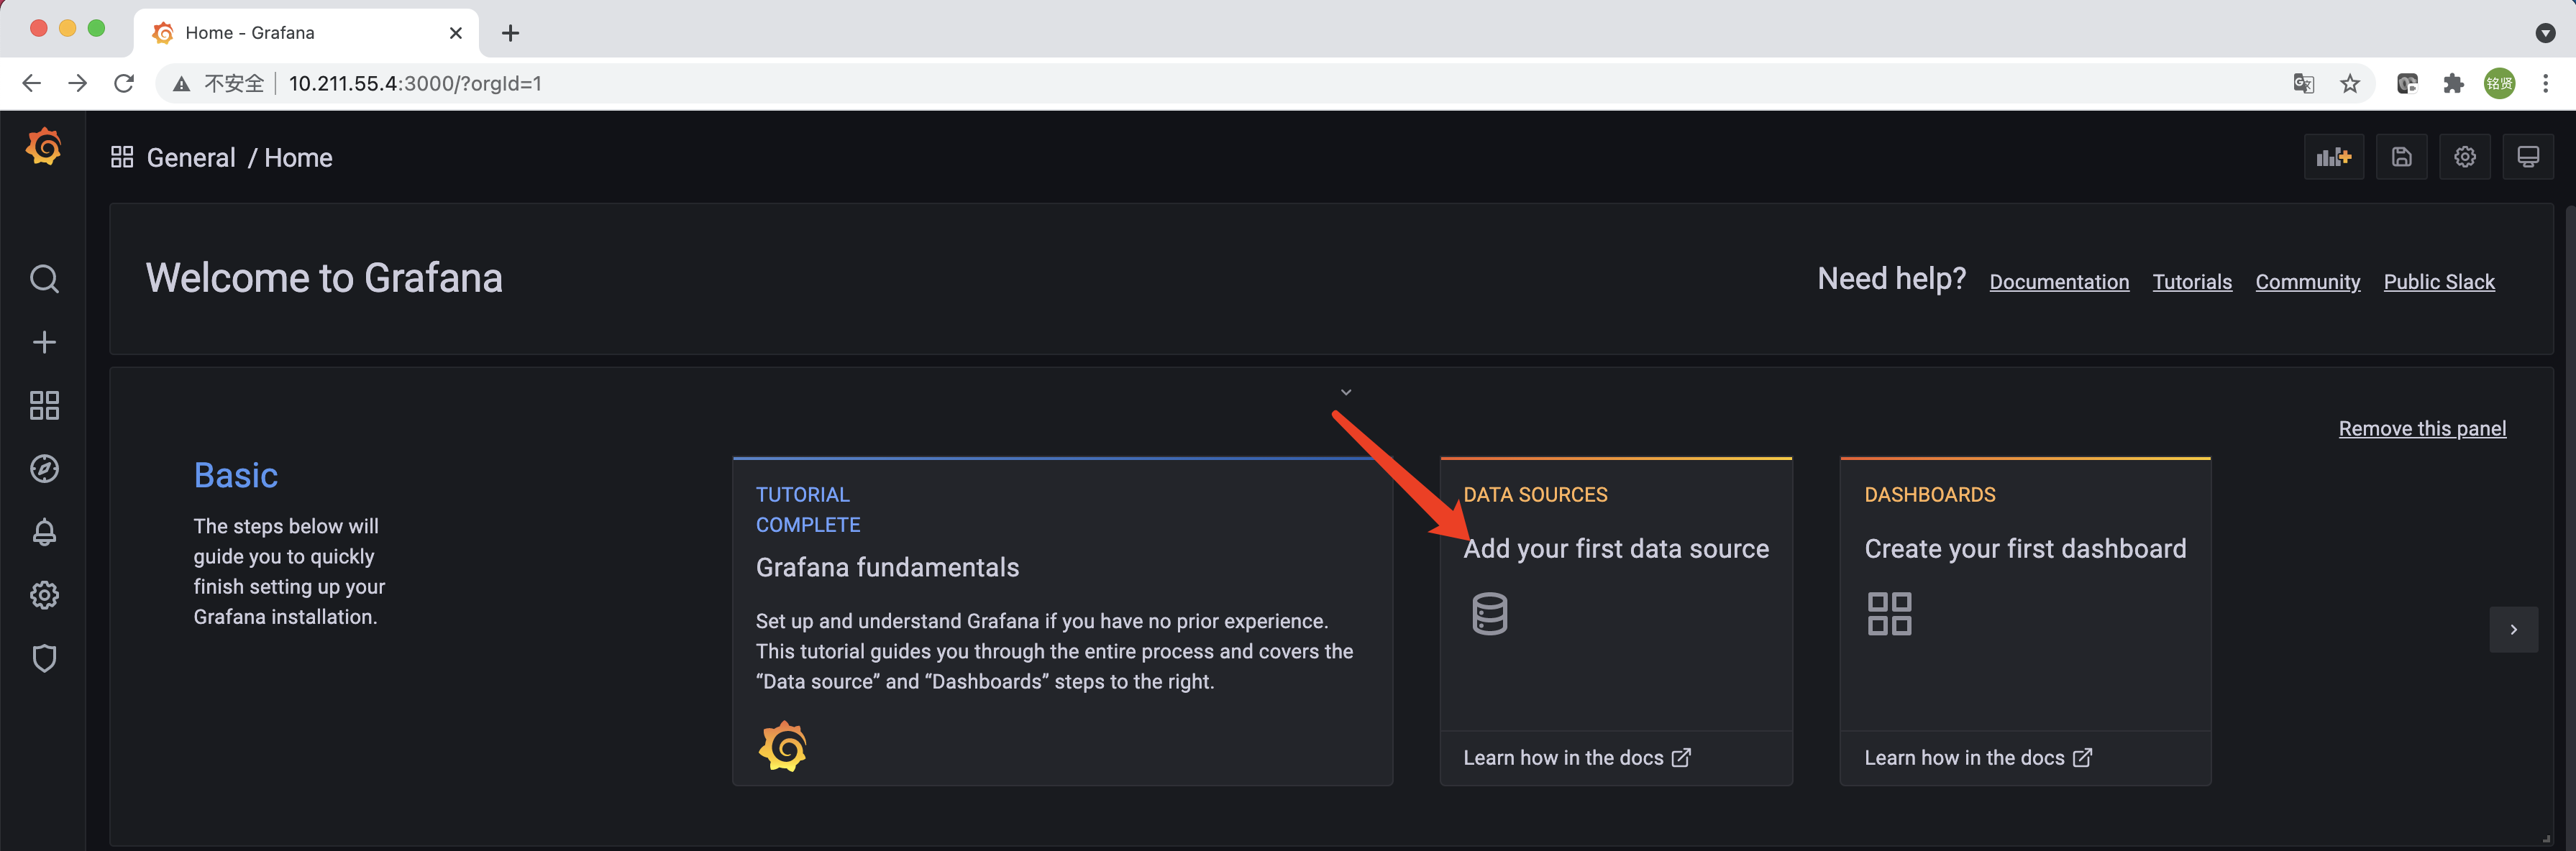
安装完成后访问http://<IP>:3000就可以进入到Grafana的界面中,默认情况下使用账户admin/admin进行登录(首次登录会要求修改默认密码)。单击"Add your first data source"添加数据源
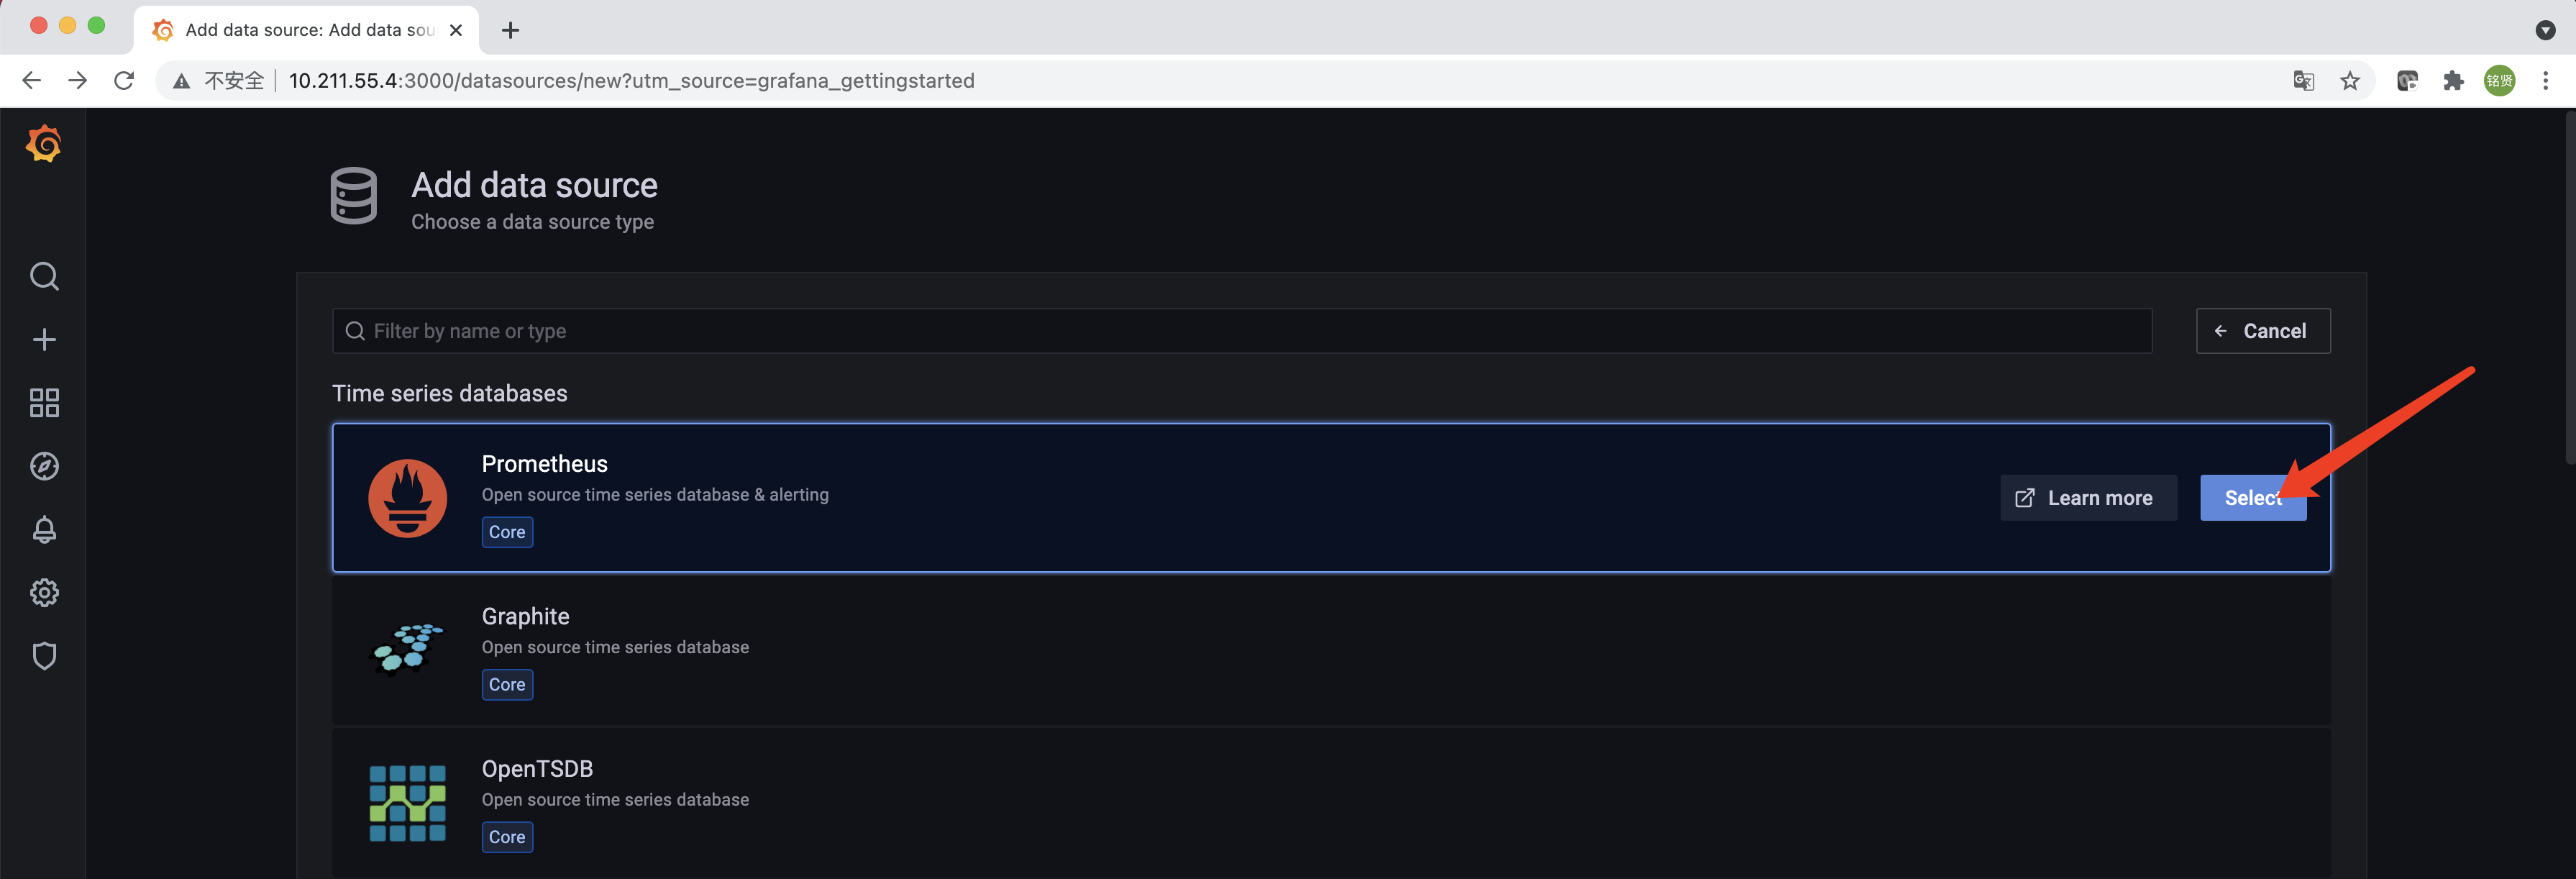
选择“Prometheus”,单击右侧的“Select”
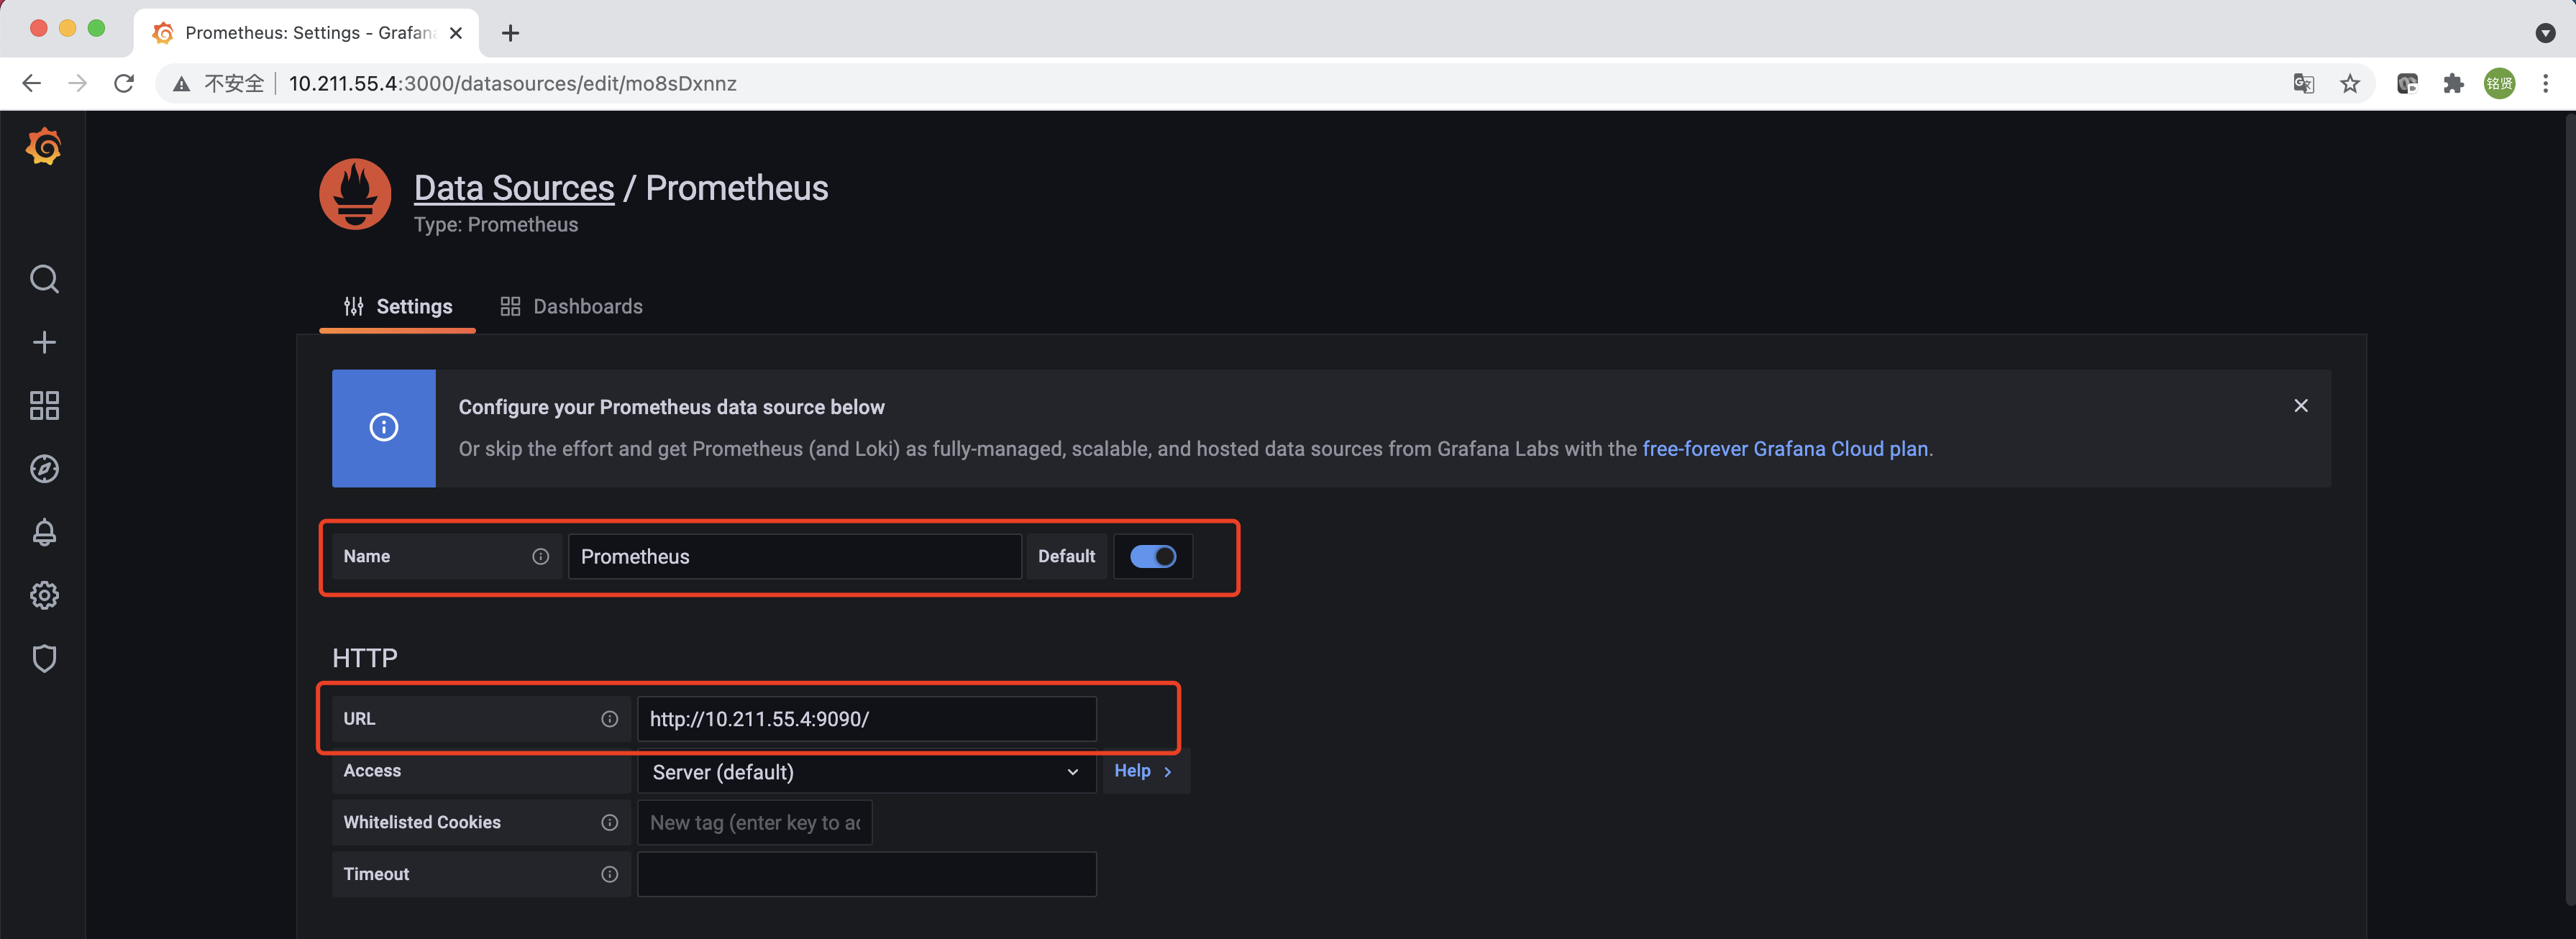
配置“Name”,勾选“Default”,“URL”填写Prometheus的访问地址,滑到最下方单击“Save & test”完成添加,配置正确的情况下会提示"Data source is working"的信息。
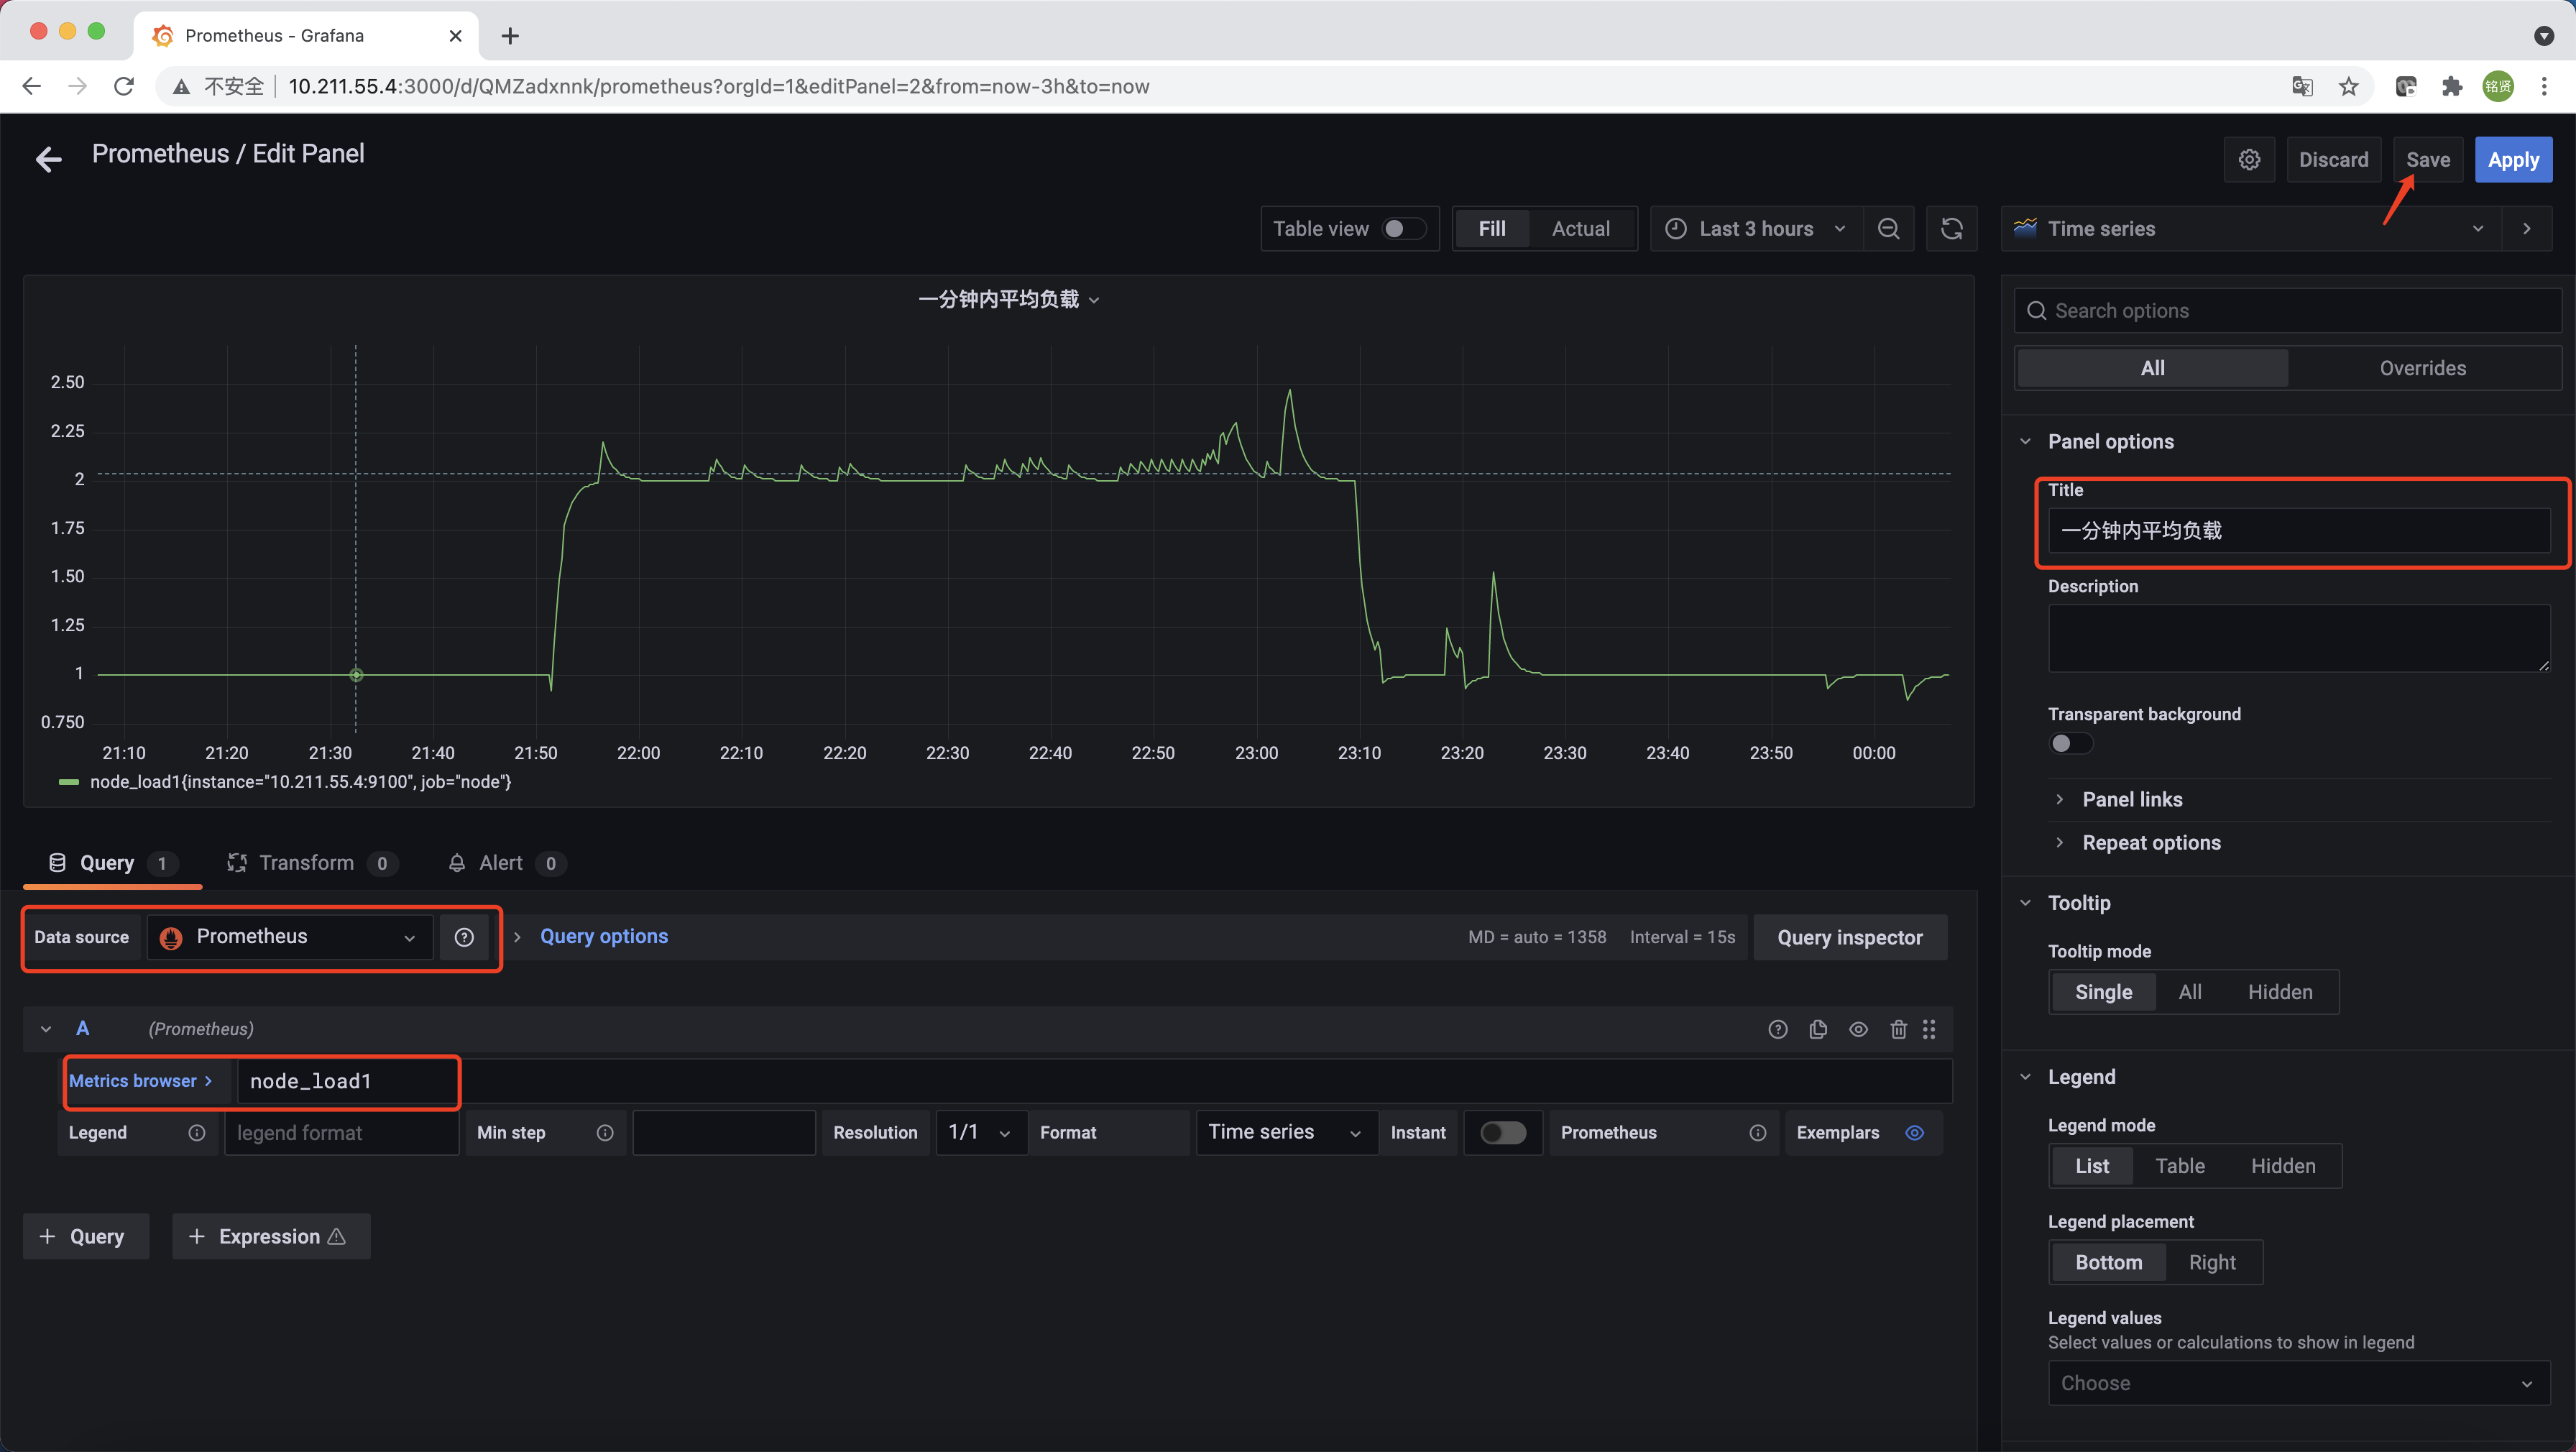
在完成数据源的添加之后就可以在Grafana中创建可视化Dashboard了,Grafana提供了对PromQL的完整支持。选择左侧"Dashboards"->"Manage"->"New Dashboard"->“Add an empty panel”。如下所示,在该面板选择“Data Source”为"Prometheus",在“Metrics browser”选项下通过PromQL查询需要可视化的数据,“Title”部分设置可视化数据的指标名称。最后单击界面中右上角的“Save”选项,就创建了我们的第一个可视化Dashboard了。
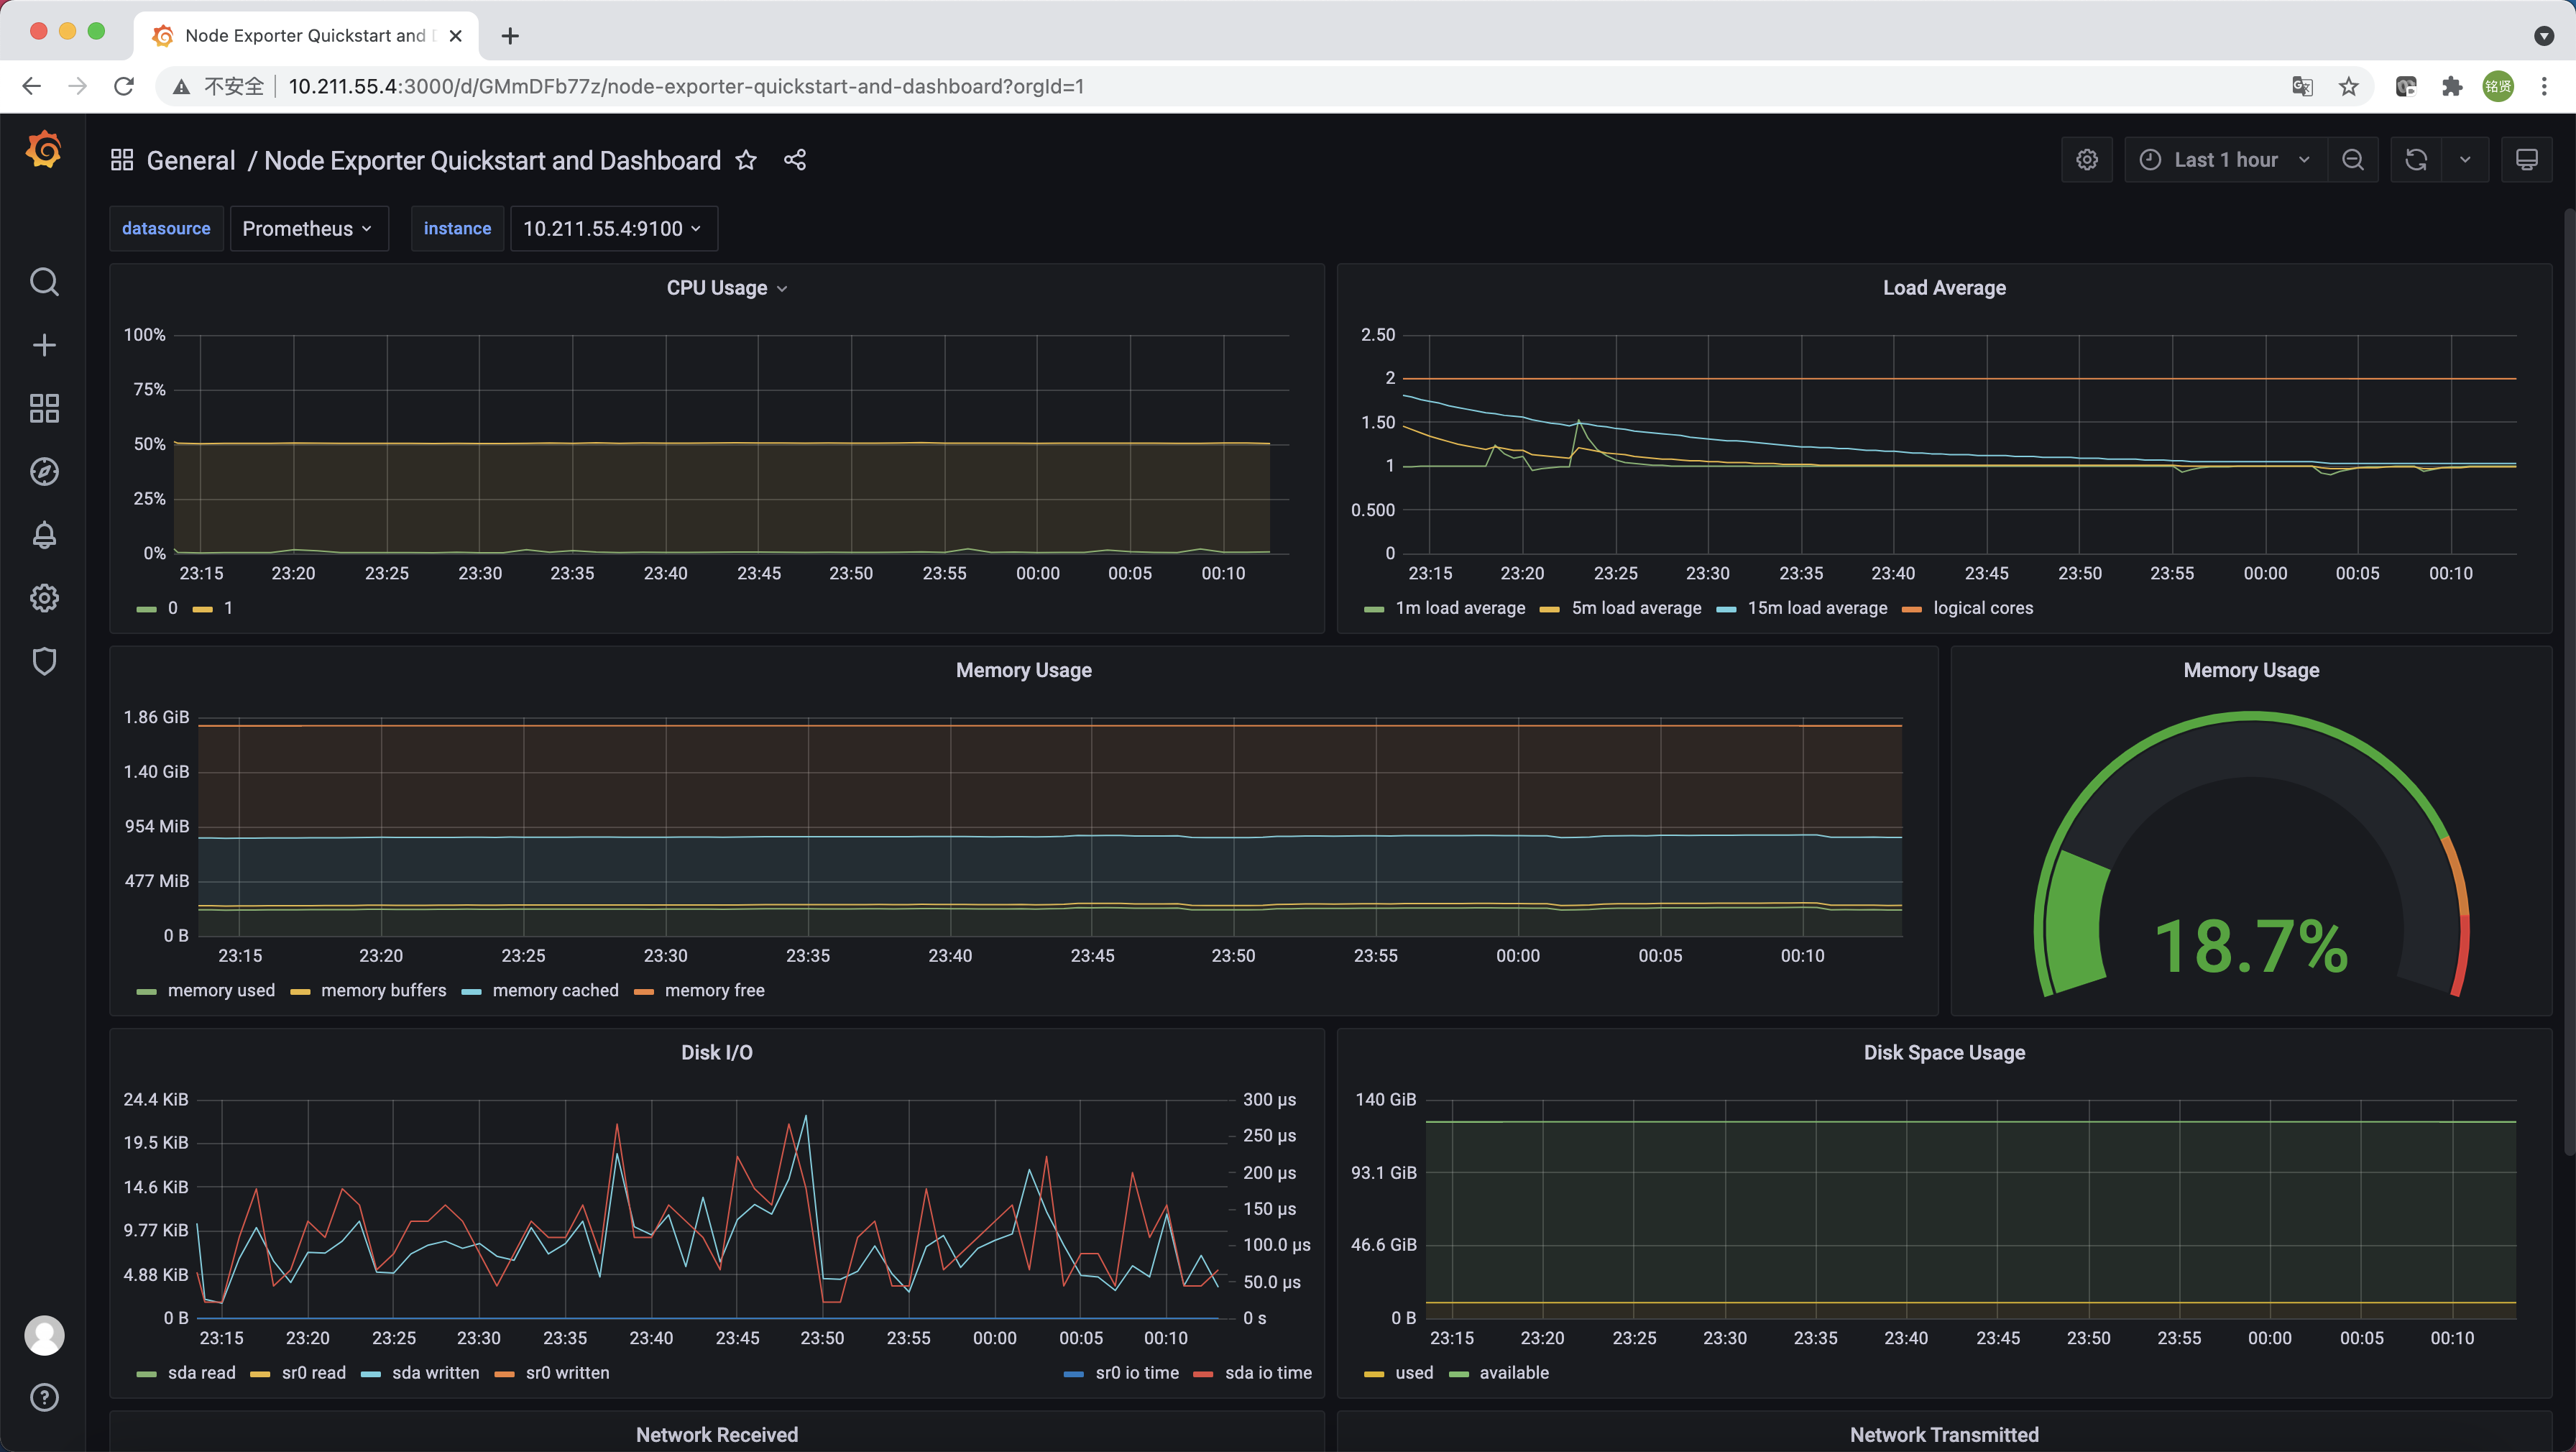
也可以在https://grafana.com/dashboards找到大量可直接使用的Dashboard。Dashboard通过JSON进行共享,下载并且导入这些JSON文件,就可以直接在"Dashboards"->"Manage"->"Import"导入这些已经定义好的Dashboard。下图为导入的Node Exporter Quickstart and Dashboard